

Infographic Gallery
Browse AI-generated infographic examples across industries and topics
 Technology & SaaS
 Healthcare
 Finance & FinTech
 Education
 Marketing
 Sustainability & ESG
 E-Commerce
 Real Estate
 Food & Cuisine
 Travel & Geography
 Science & Nature

Technology & SaaS Infographics

Edge Computing Infrastructure Statistics 2026
Edge computing infrastructure spending reached $92 billion in 2026, up 24%. See latency benchmarks, 5G small-cell growth, IoT scale, and key use cases.
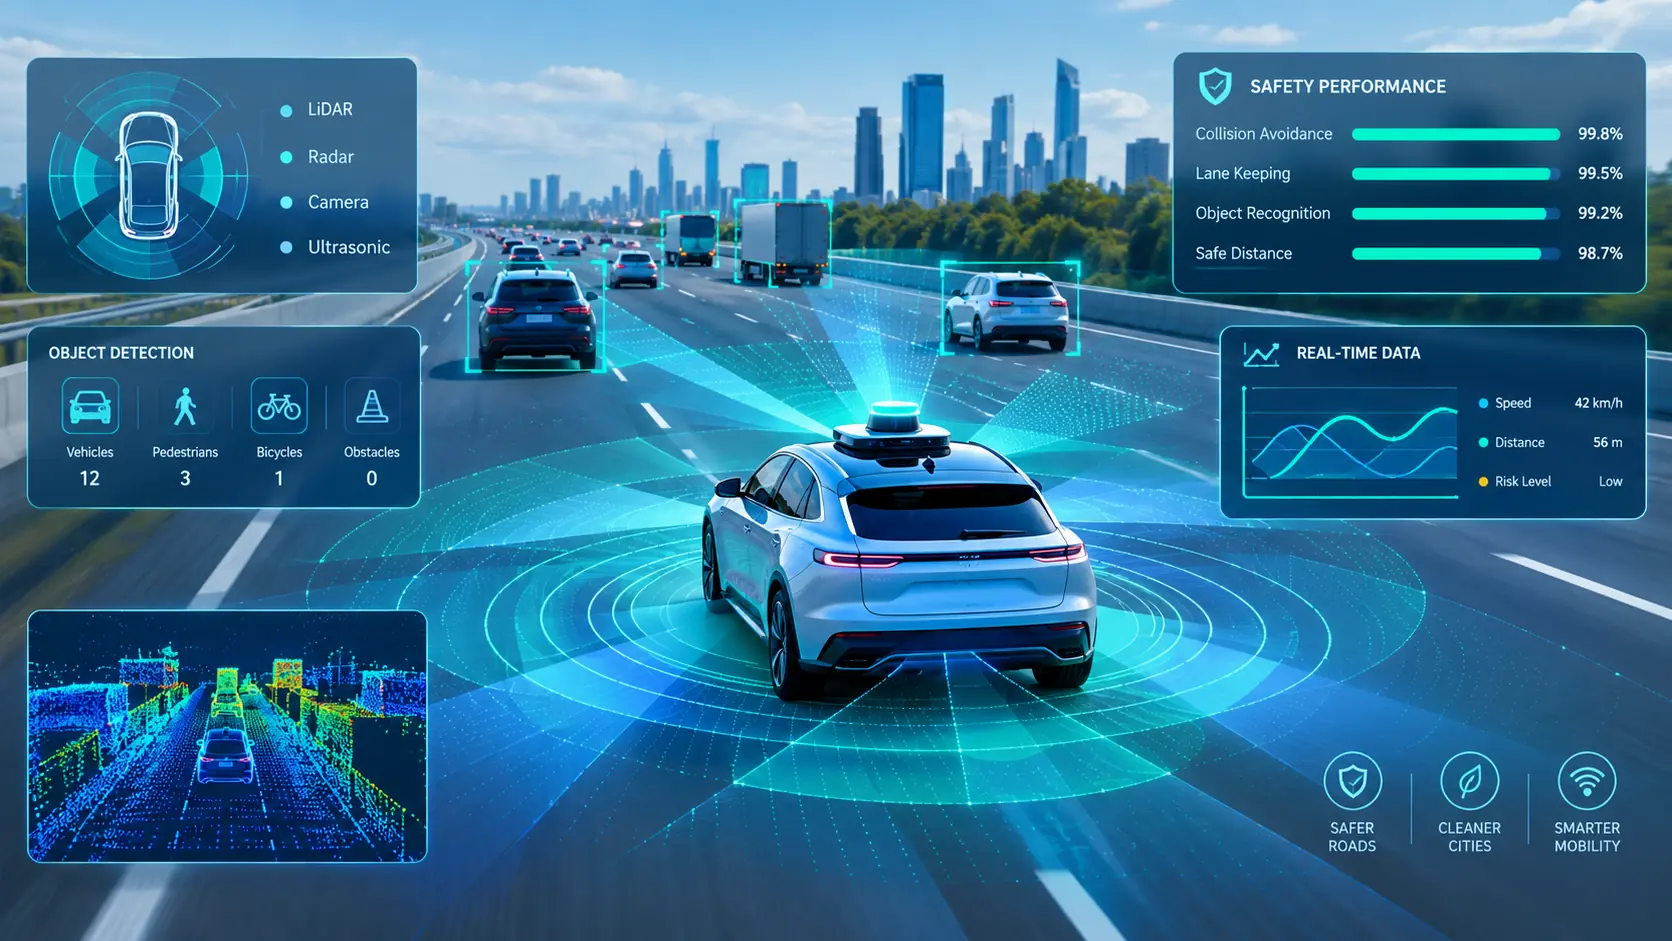
Autonomous Vehicle Safety Statistics 2026
Self-driving car safety data, accident rates vs human drivers, sensor technology layers, regulatory milestones, and AV deployment statistics worldwide.
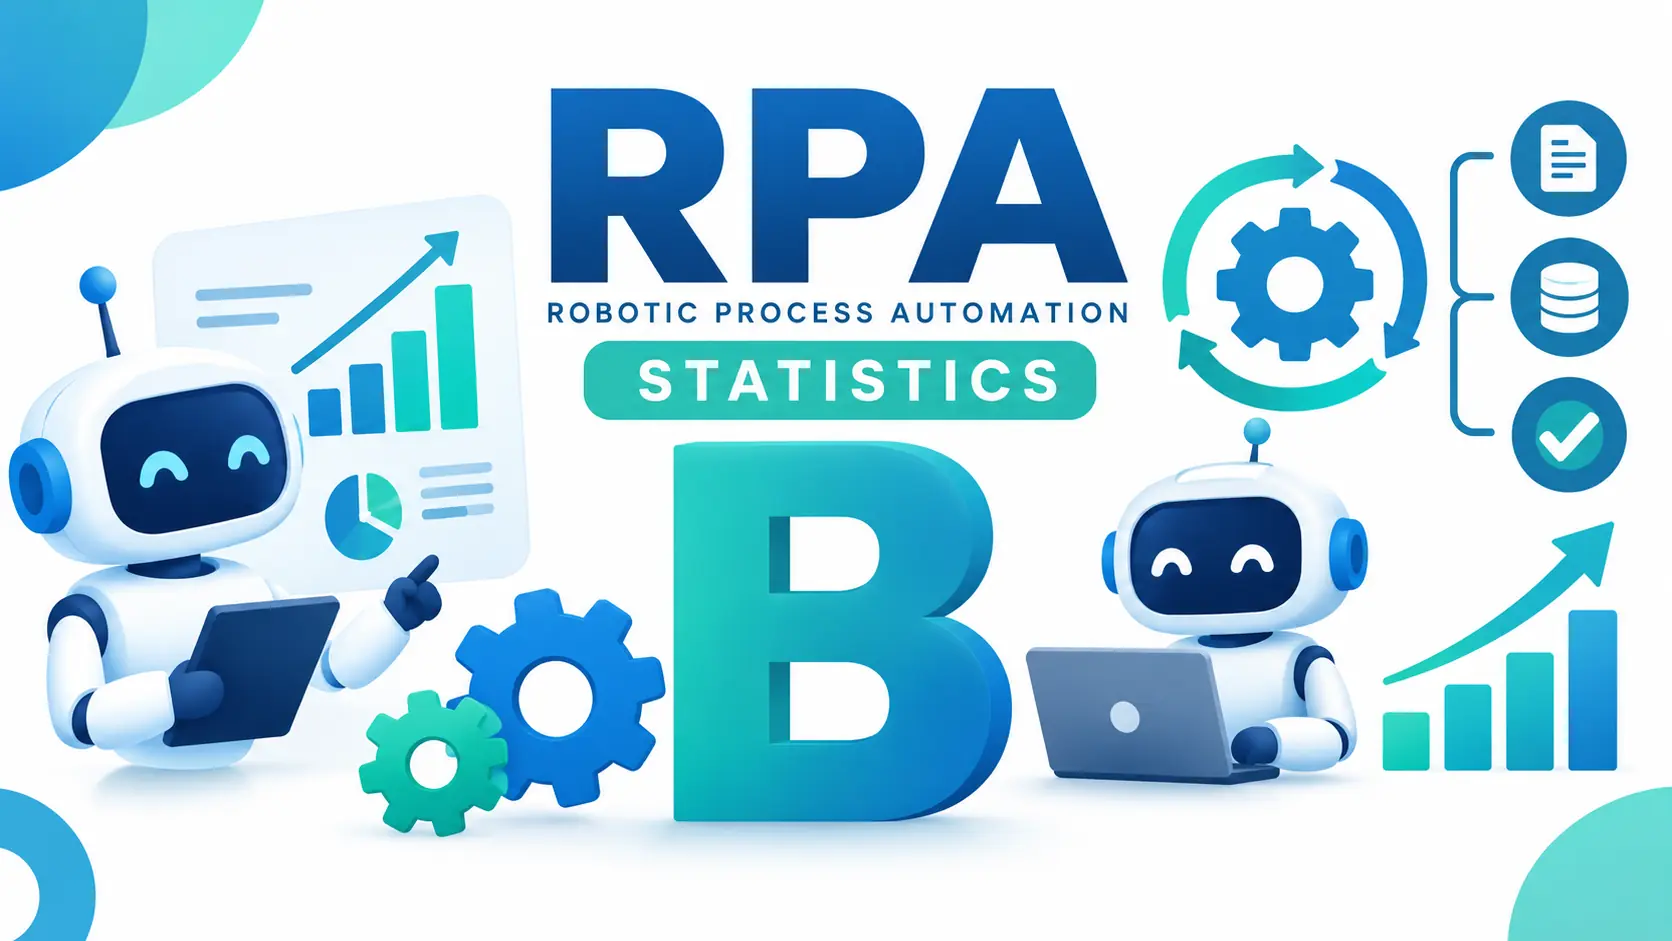
Robotic Process Automation (RPA) Statistics & Market Trends 2026
RPA market data: $22B industry valuation, 65% enterprise adoption, bot deployment stats, cost savings metrics, and leading automation use cases.

Sustainability & ESG Infographics
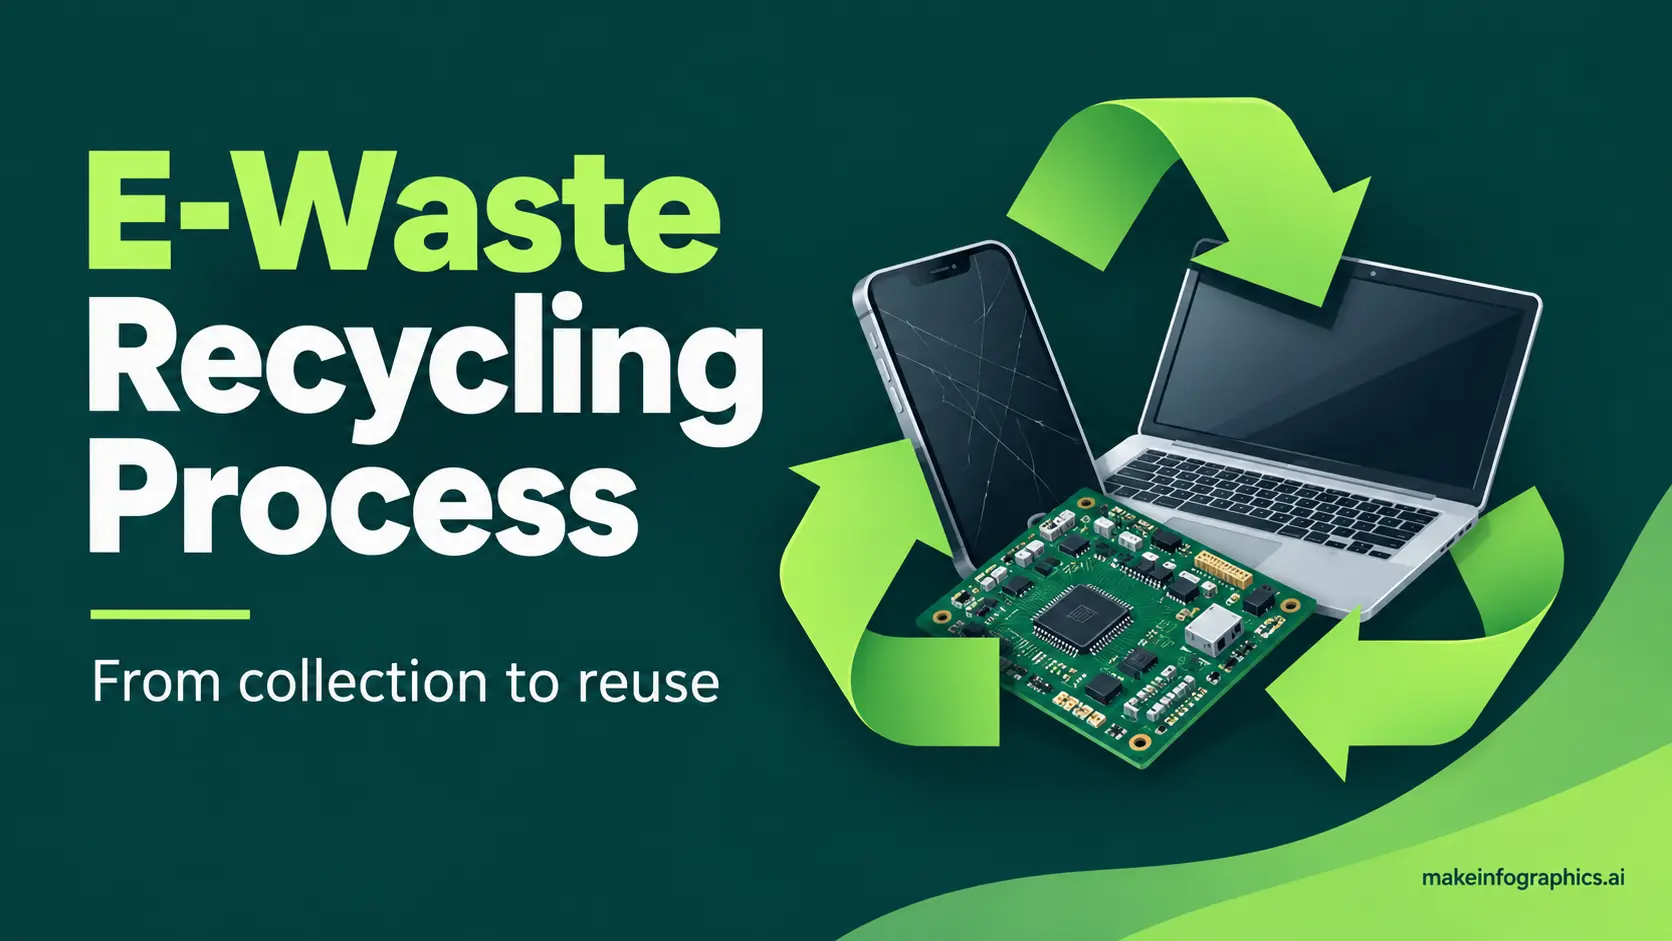
E-Waste Recycling Process & Global Statistics 2026
Global e-waste hit 62 million tonnes in 2022; only 22.3% was formally recycled—how collection, dismantling, shredding, separation, and recovery work.
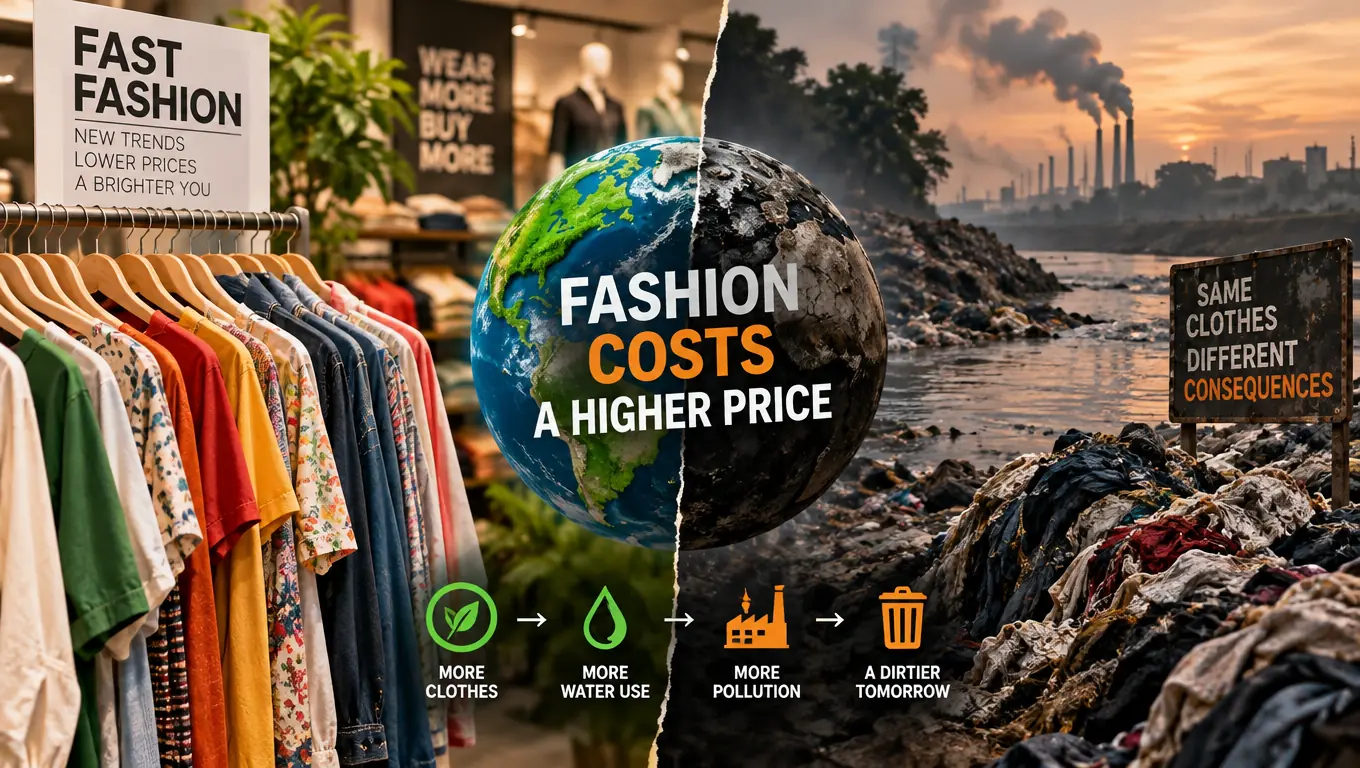
Fast Fashion vs Sustainable Fashion 2026
Fashion emits 8–10% of global CO2 and 92M tons of textile waste yearly. Compare fast vs sustainable models on water, labor, waste, and resale.
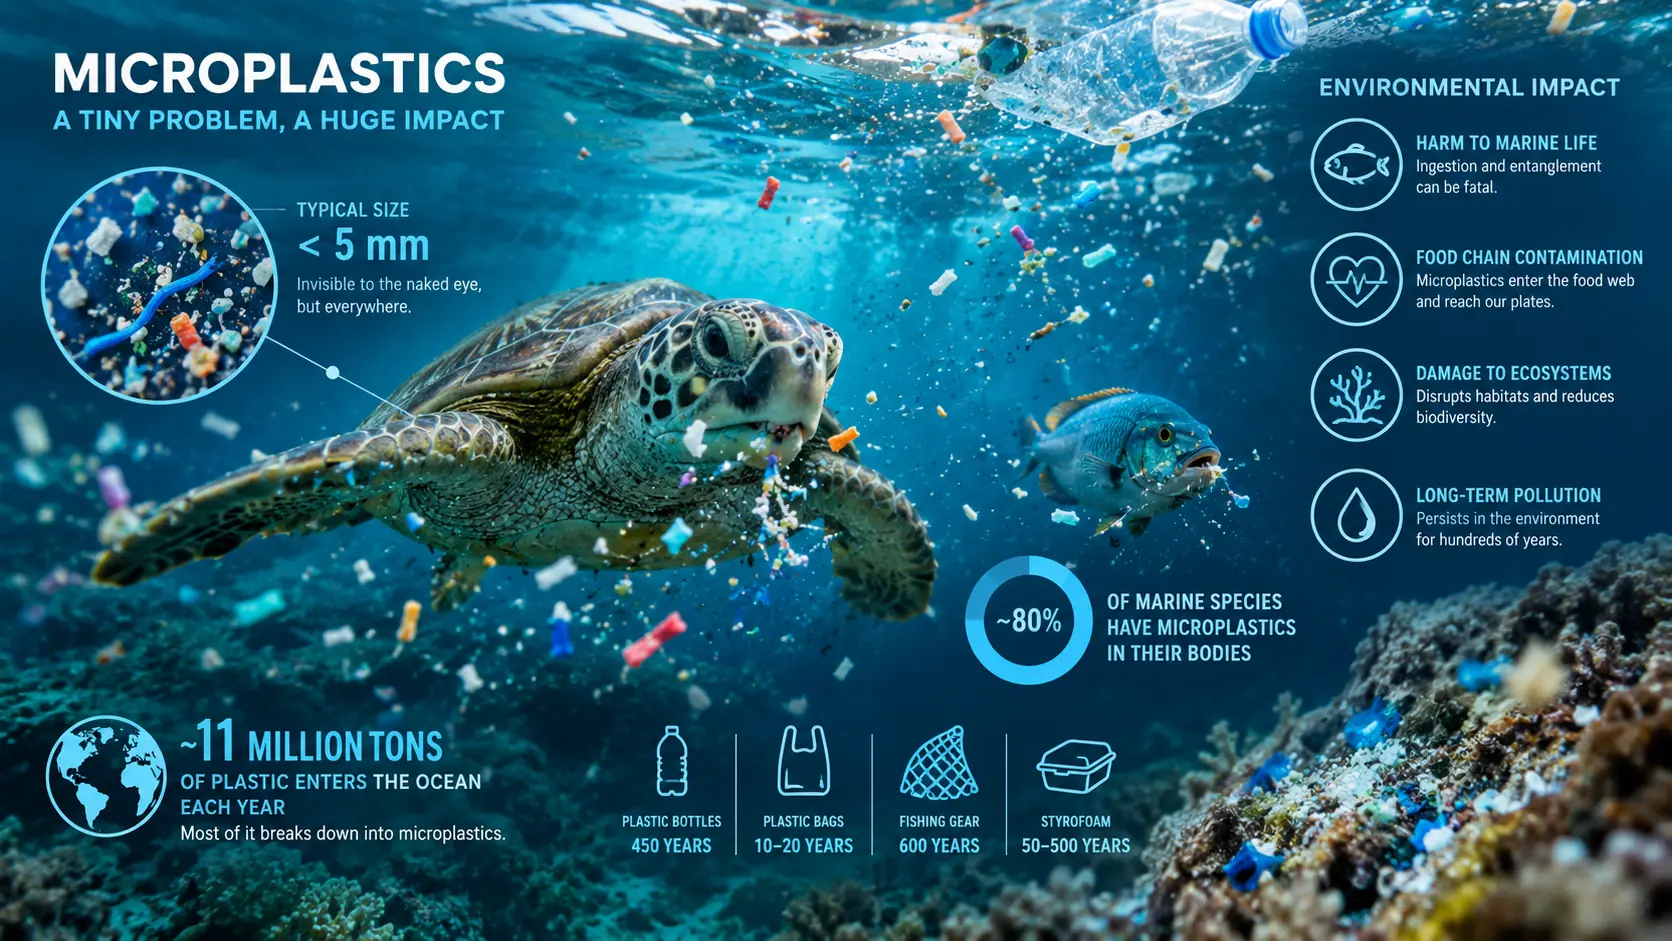
Microplastics: The Invisible Pollution Crisis 2026
Microplastics in oceans, soil, and blood: 14.4M tons on the seabed, ~5 g ingested weekly, tire wear at 28%, and 80+ nations curbing plastics.

Marketing Infographics
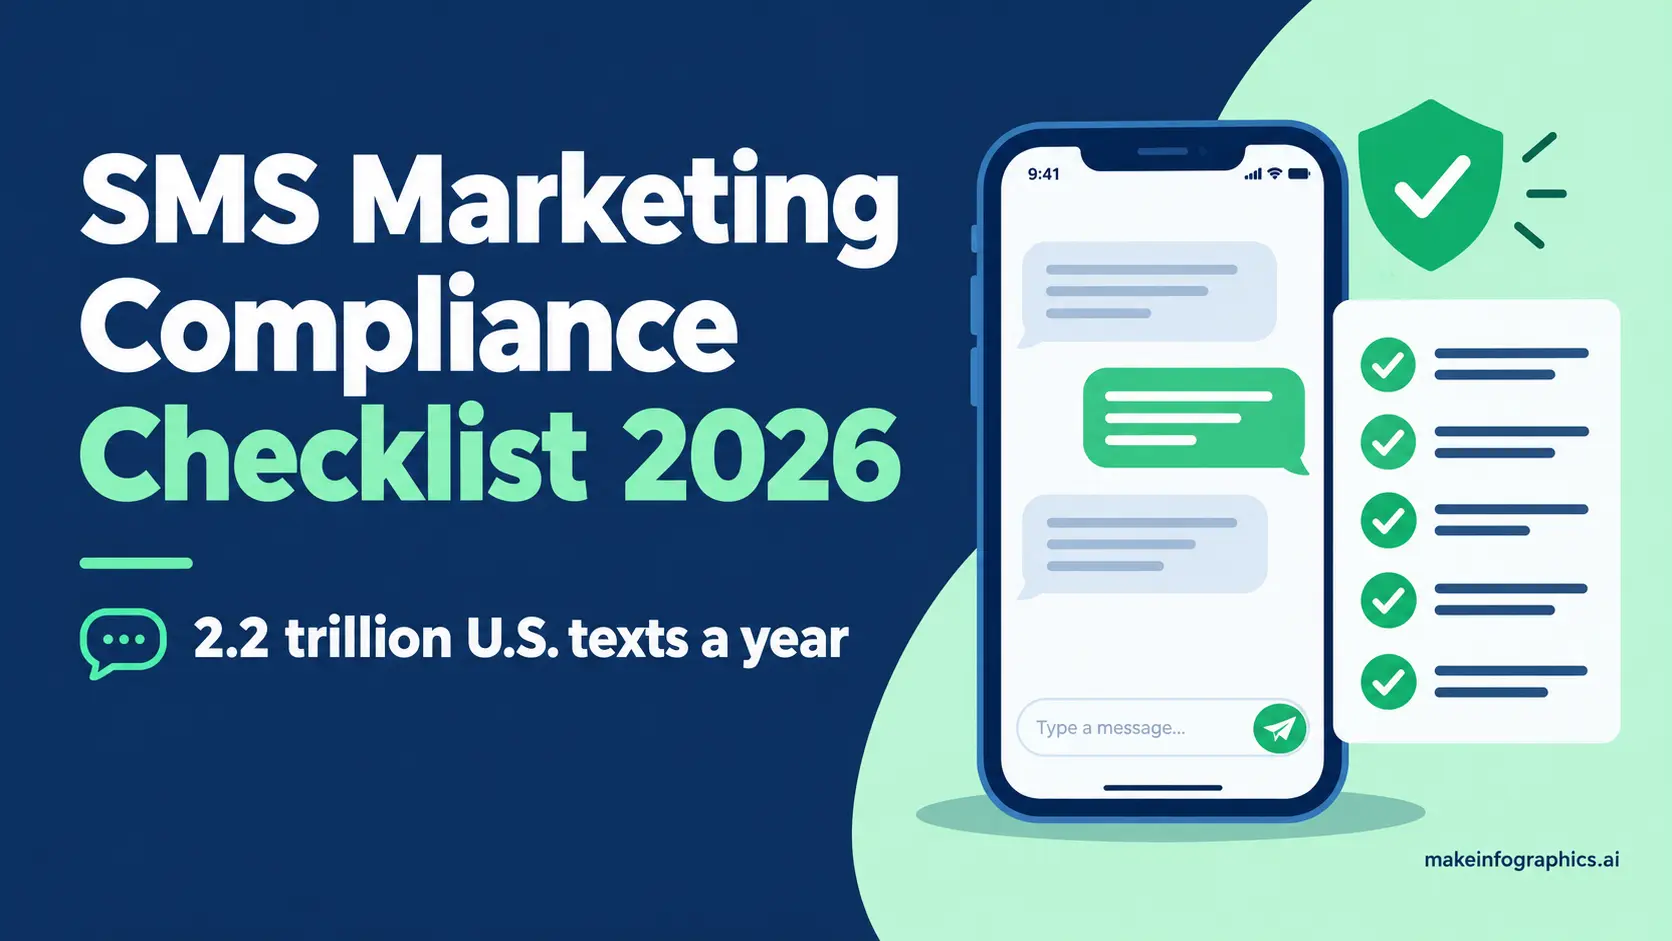
SMS Marketing Statistics & Compliance Checklist 2026
SMS marketing checklist 2026: 2.2 trillion U.S. texts yearly, plus TCPA consent, opt-outs, 10DLC registration, and verified ecommerce SMS CTR benchmarks.
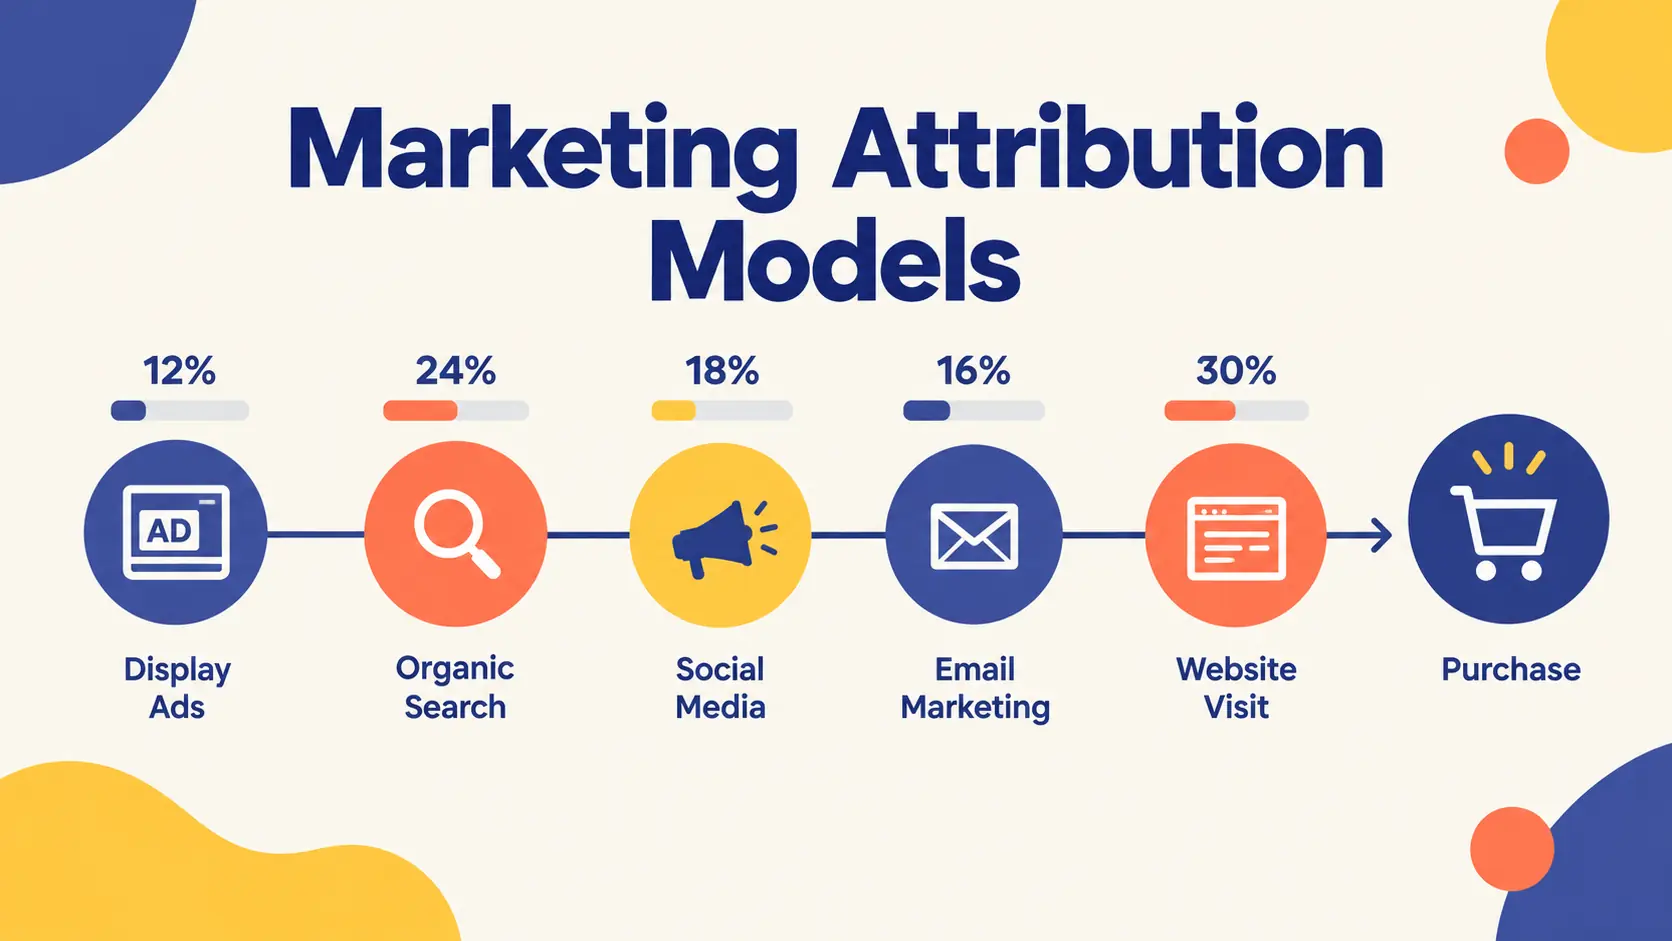
Marketing Attribution Models Explained: Guide 2026
Marketing attribution models compared: first-touch, last-touch, linear, time-decay, position-based, and data-driven, with tips on choosing one.
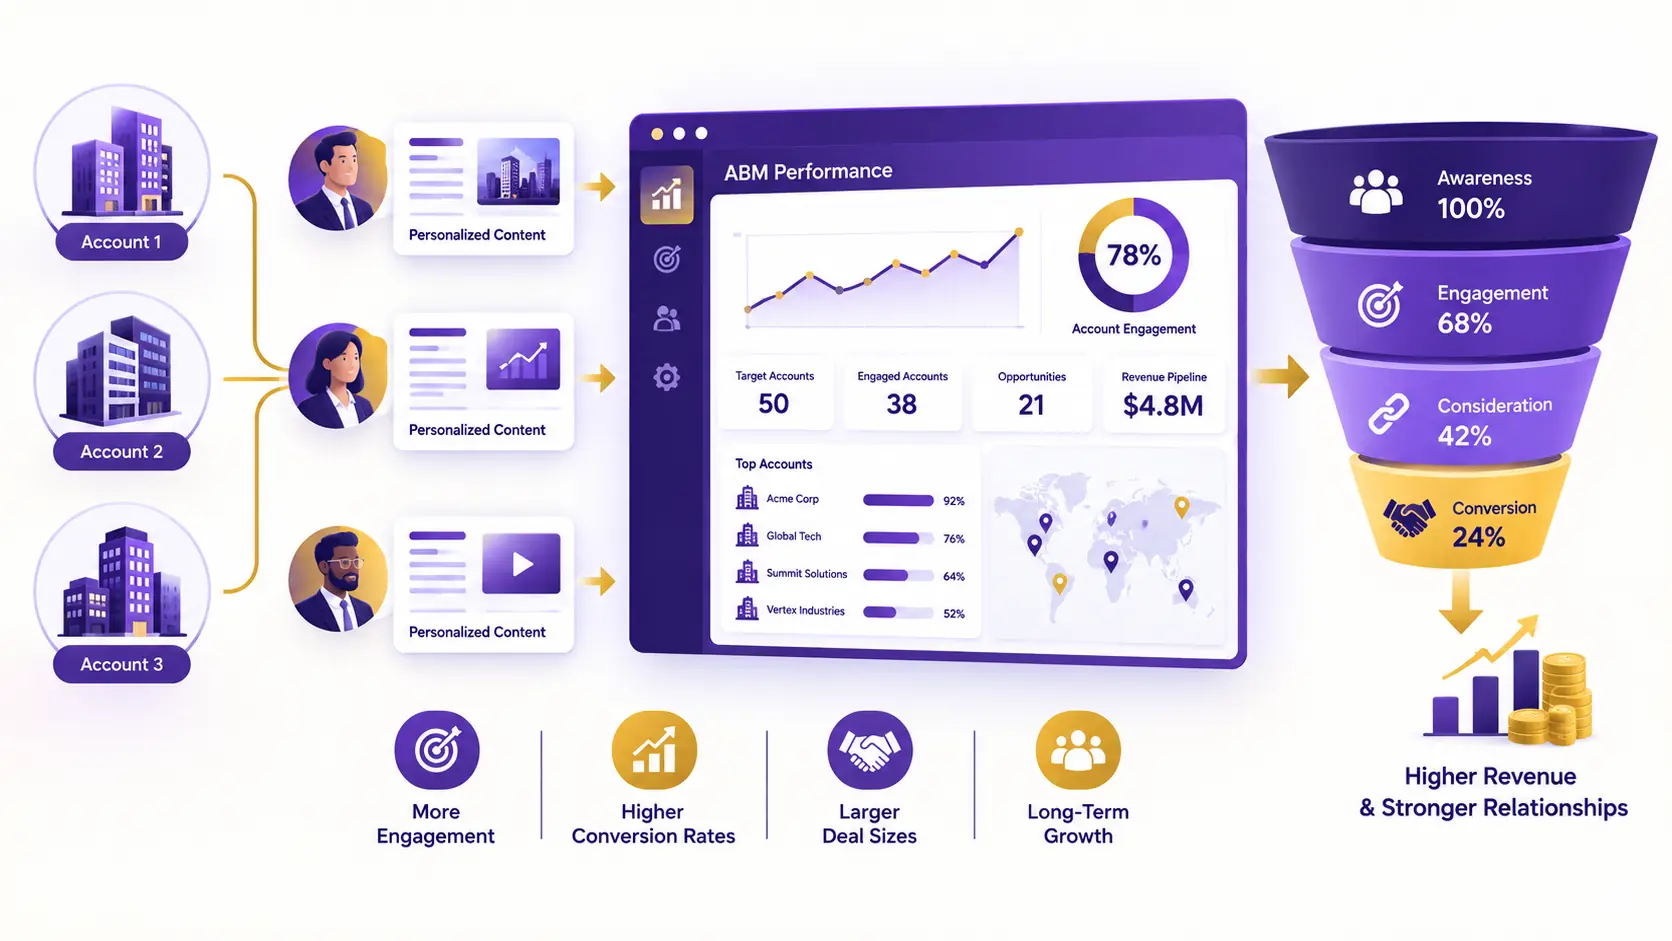
Account-Based Marketing Statistics 2026
ABM strategy process, ROI benchmarks, adoption rates, technology stack, and performance comparison versus traditional demand generation approaches.

Healthcare Infographics
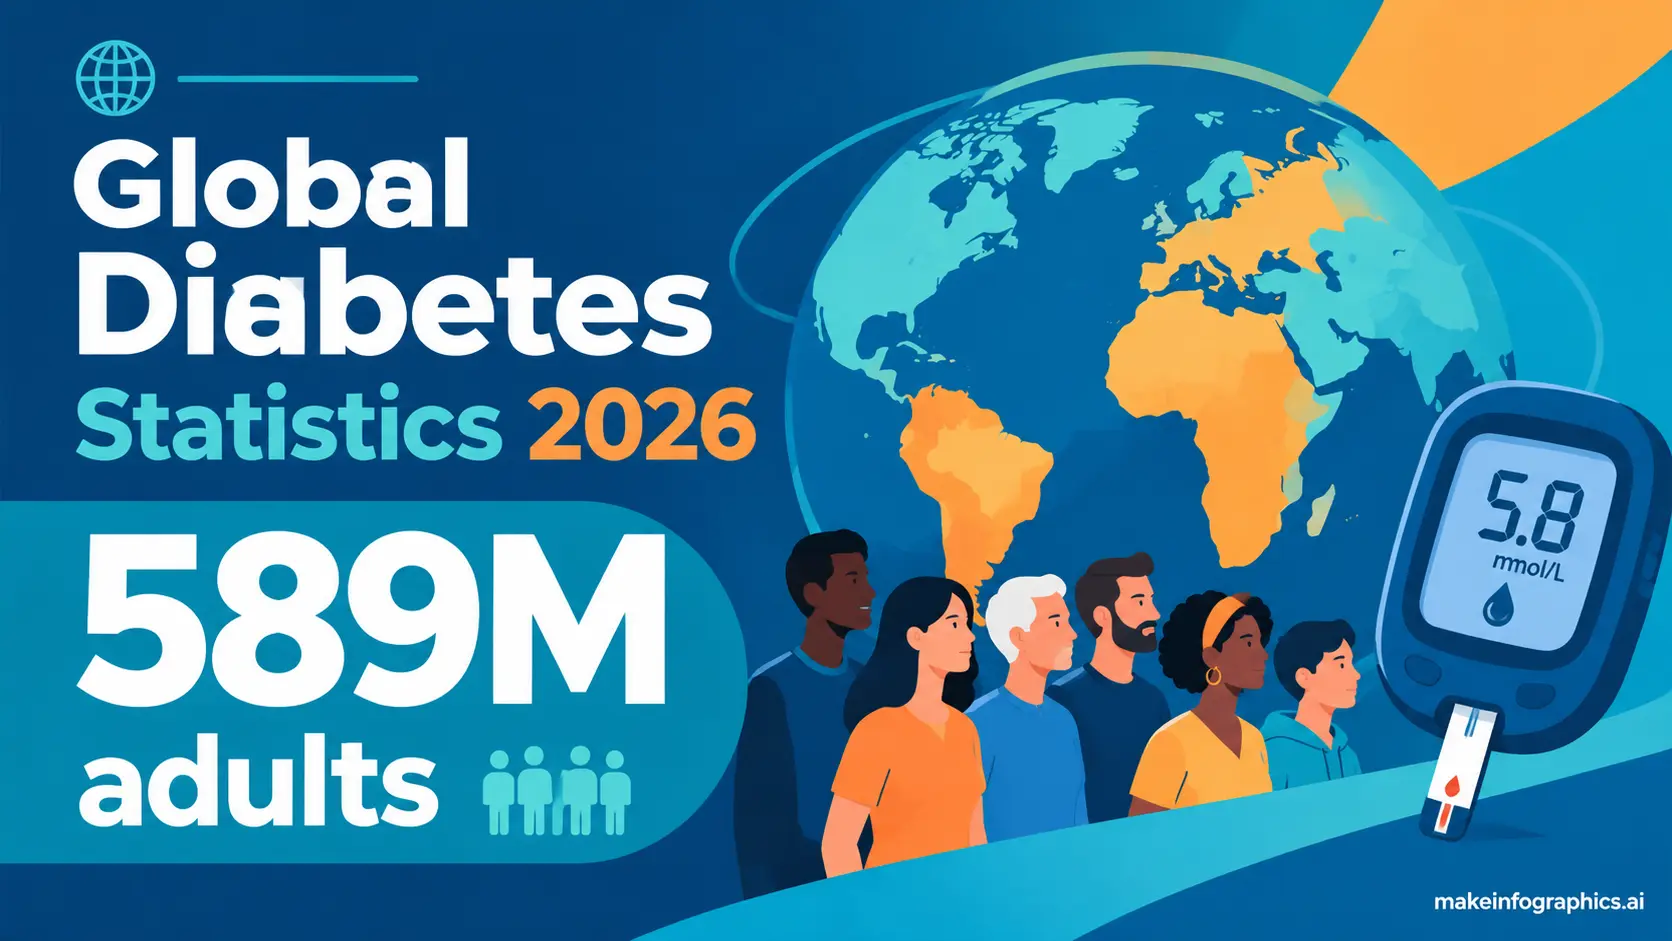
Global Diabetes Statistics 2026: Prevalence, Costs & Regions
About 589 million adults had diabetes in 2024 per the IDF Diabetes Atlas 11th edition—see global prevalence, undiagnosed share, spending, and prevention.
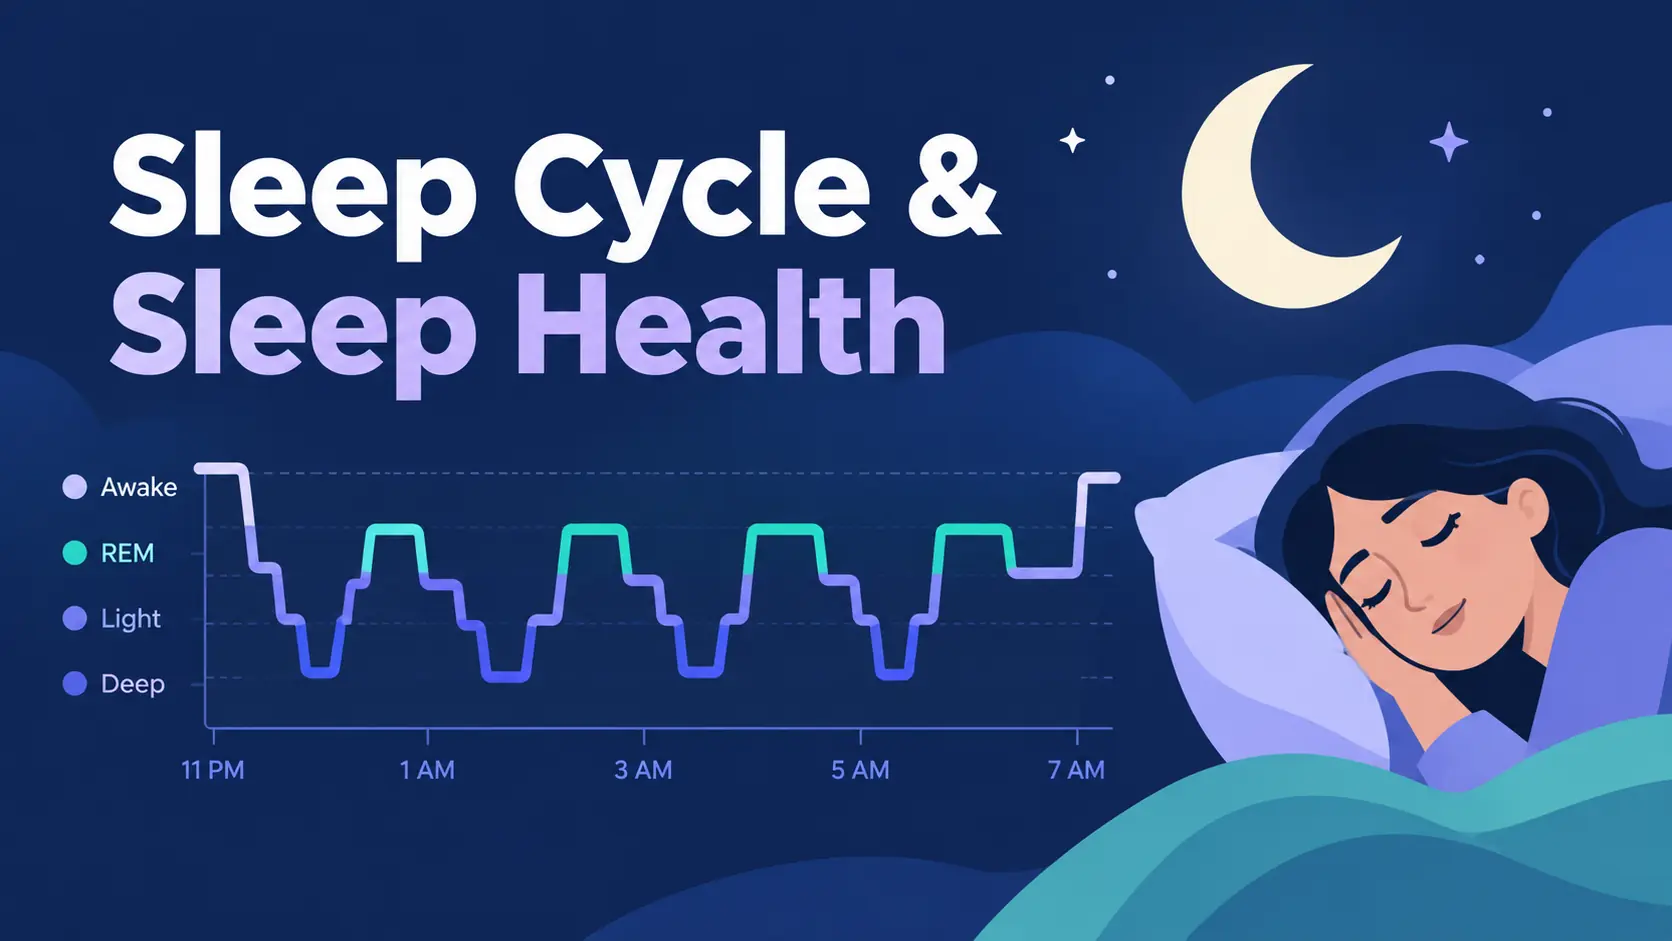
Sleep Cycle Stages & Sleep Health: What Happens at Night
Sleep cycle stages explained: N1, N2, deep N3, and REM, plus recommended sleep hours by age and a checklist for better sleep health.

Global Youth Mental Health Crisis 2026
Youth mental health in 2026: 250M affected globally, 42% of U.S. teens report persistent sadness, and heavy social media tied to higher depression risk.

Education Infographics

Evidence-Based Study Techniques: What Works in 2026
Evidence-based study techniques guide: Dunlosky et al. rated practice testing and spaced practice high utility; highlighting and rereading low utility.

EdTech Funding Timeline 2015-2026
EdTech funding rebounded to $24B in 2026 on a $400B market. Timeline from 2015 through AI tutoring, pandemic surge, and global growth.

Early Childhood Education: The Evidence 2026
Research-backed benefits of pre-K education: cognitive development, school readiness, lifetime earnings impact, enrollment rates, and program ROI data.

Finance & FinTech Infographics

Central Bank Digital Currencies (CBDC) Statistics 2026
134 economies explore CBDCs in 2026; China’s e-CNY passed $300B in volume. Retail vs wholesale models, mBridge, and digital euro timing.
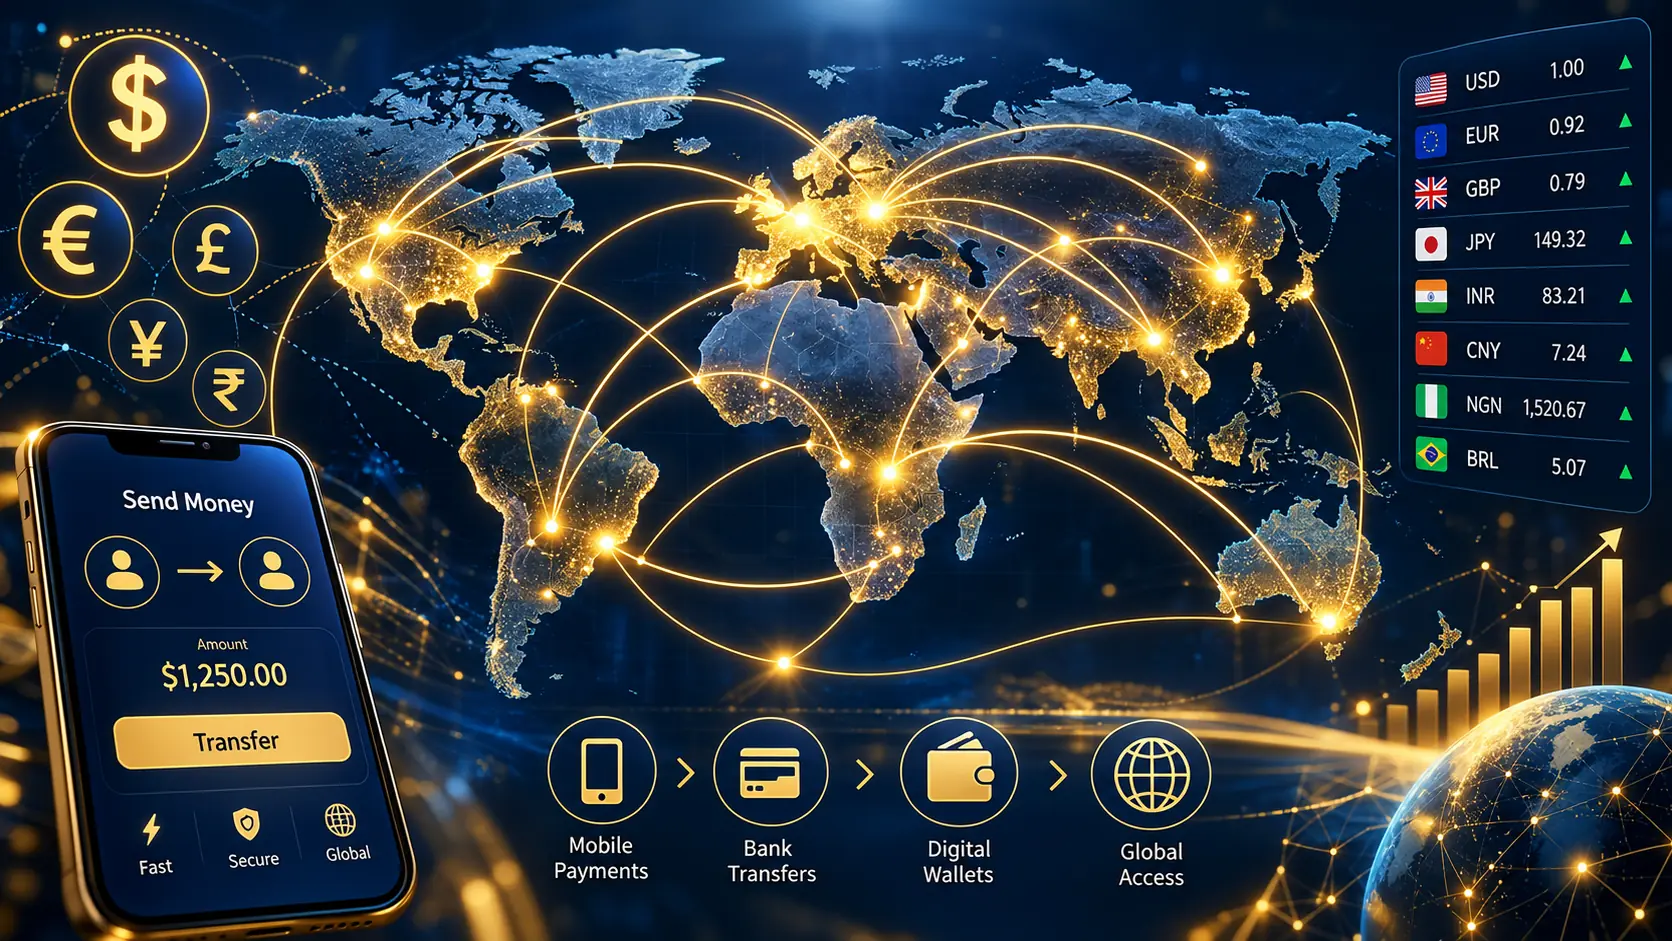
Global Remittance Statistics 2026
Global remittances hit $860B in 2026; India leads receipts at $125B, digital channels are 58% of flows, and average fees fell to 4.2%.

Global Wealth Inequality Statistics 2026
Wealth distribution data: top 1% vs bottom 50% ownership, Gini coefficients by country, billionaire wealth growth, and intergenerational mobility trends.

E-Commerce Infographics
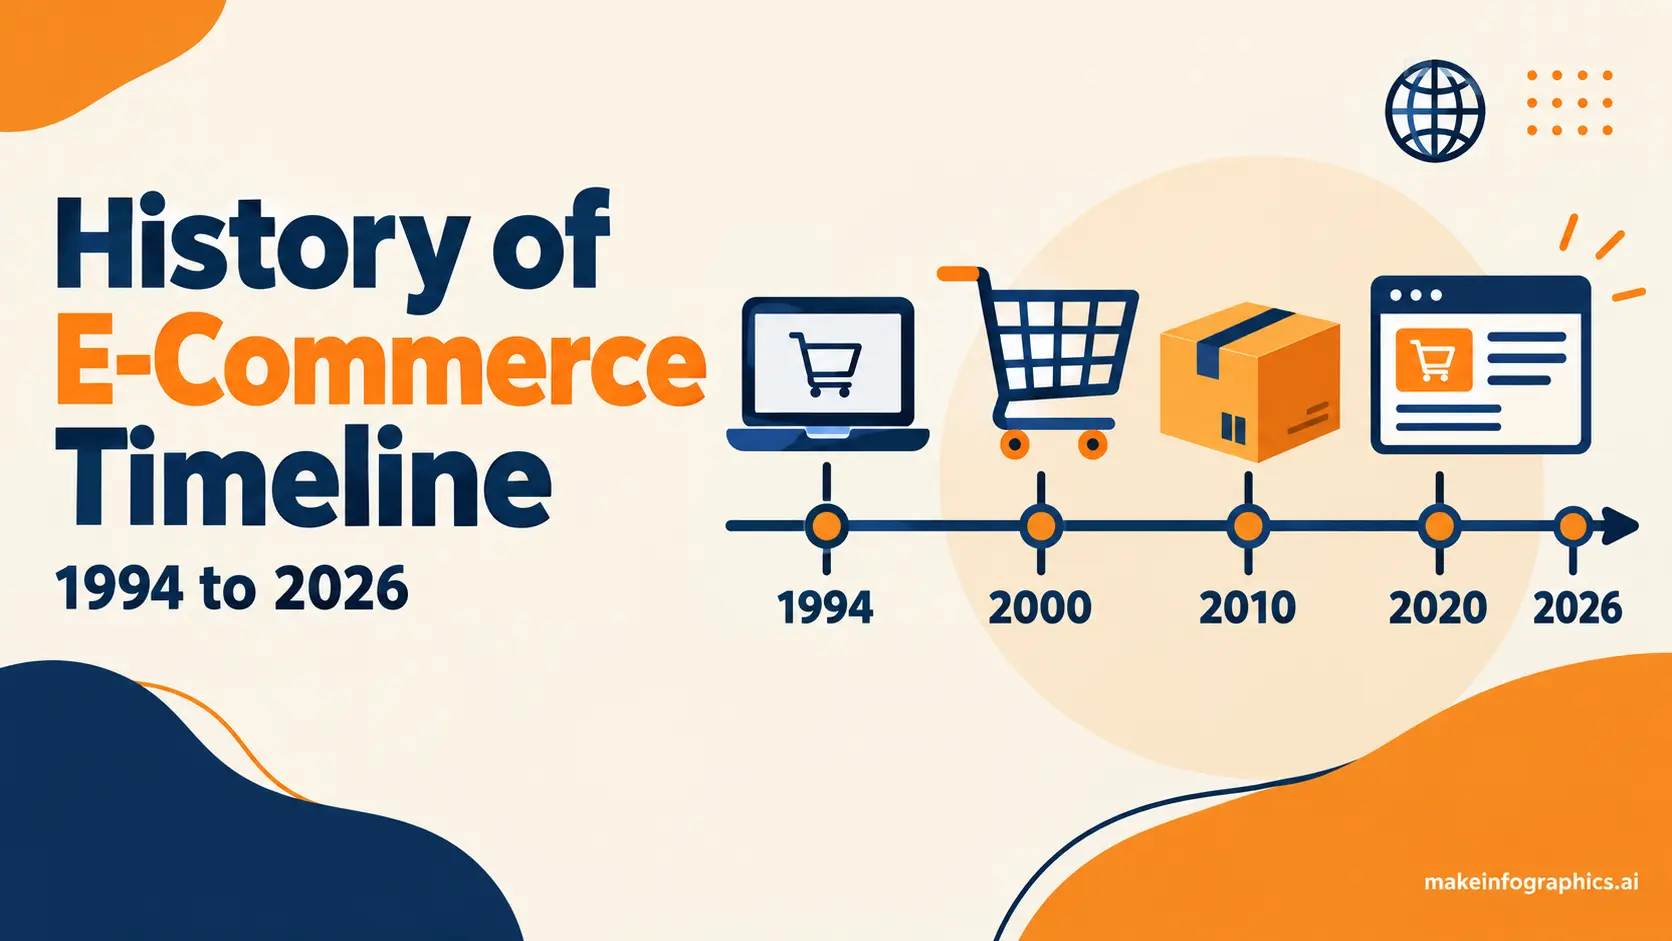
History of E-Commerce: Online Shopping Milestones Timeline
E-commerce history timeline from the first secure 1994 online sale to Q2 2026, when U.S. retail e-commerce reached 17.1% of total sales (Census Bureau).

Ecommerce Conversion Rate Optimization Checklist 2026
Ecommerce CRO checklist for 2026: fix product pages, cart, and checkout friction, using cart abandonment data from Baymard Institute research.
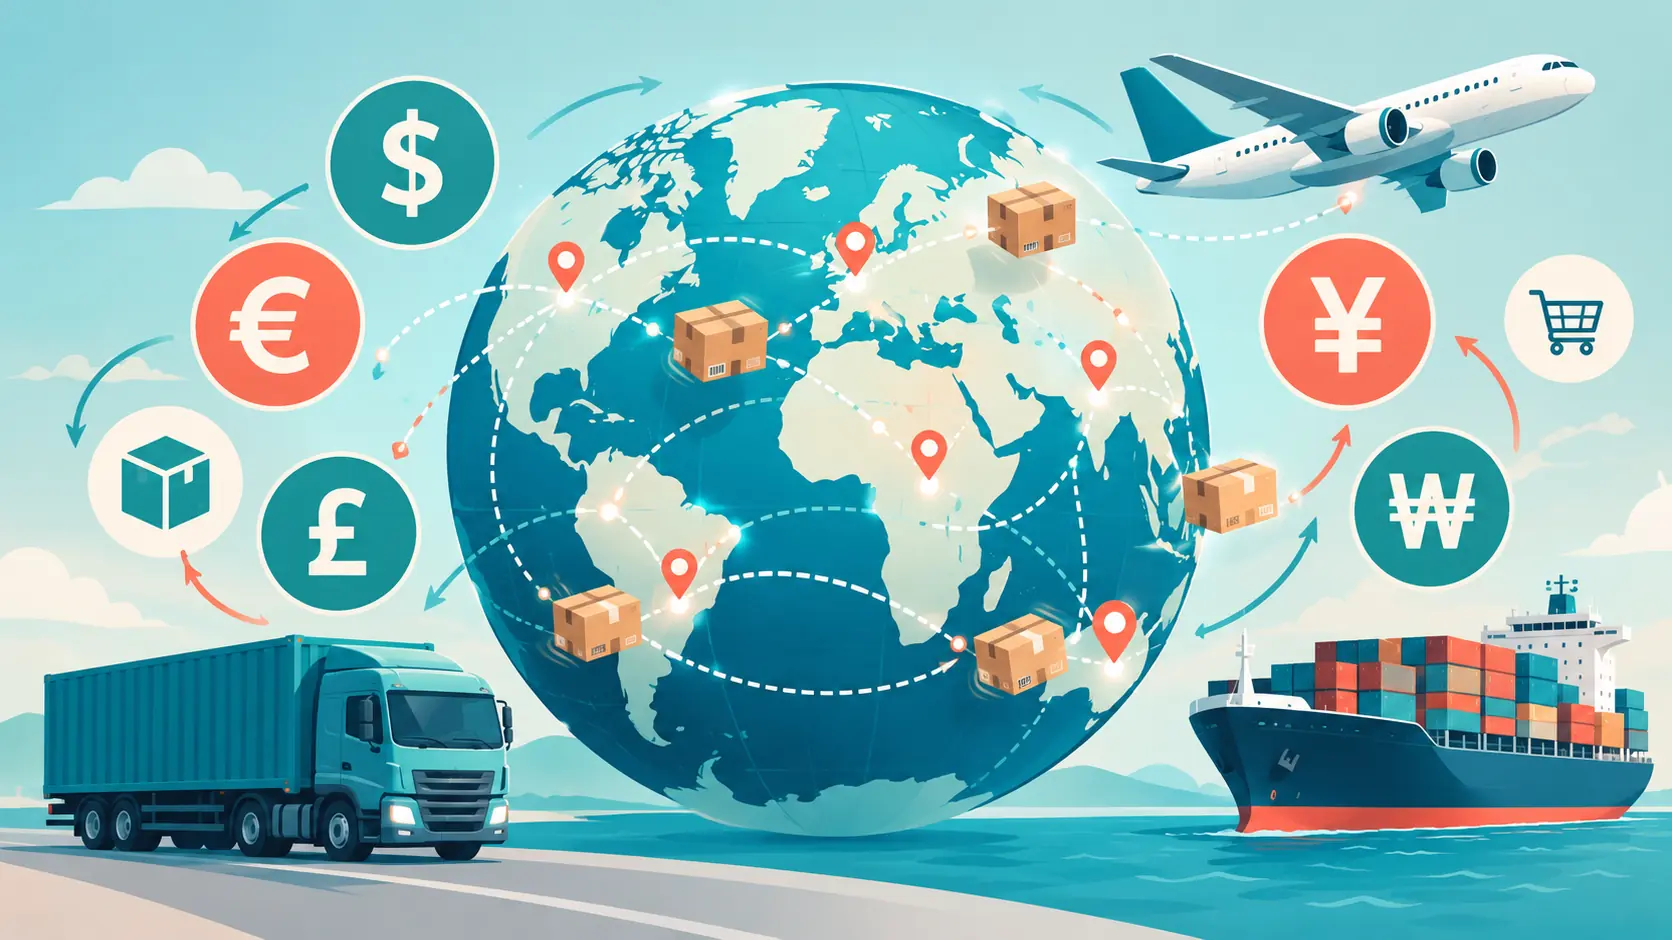
Cross-Border E-Commerce Growth Statistics 2026
Cross-border e-commerce reached $2.1T in 2026 (22% of online sales); 2.3B shoppers bought abroad, with 73% of orders on mobile.

Food & Cuisine Infographics

Major Food Allergens & Label Reading Checklist 2026
Nine FDA major allergens (sesame 2023) and 14 EU Annex II allergens: Contains labels, may contain warnings, cross-contact, epinephrine.
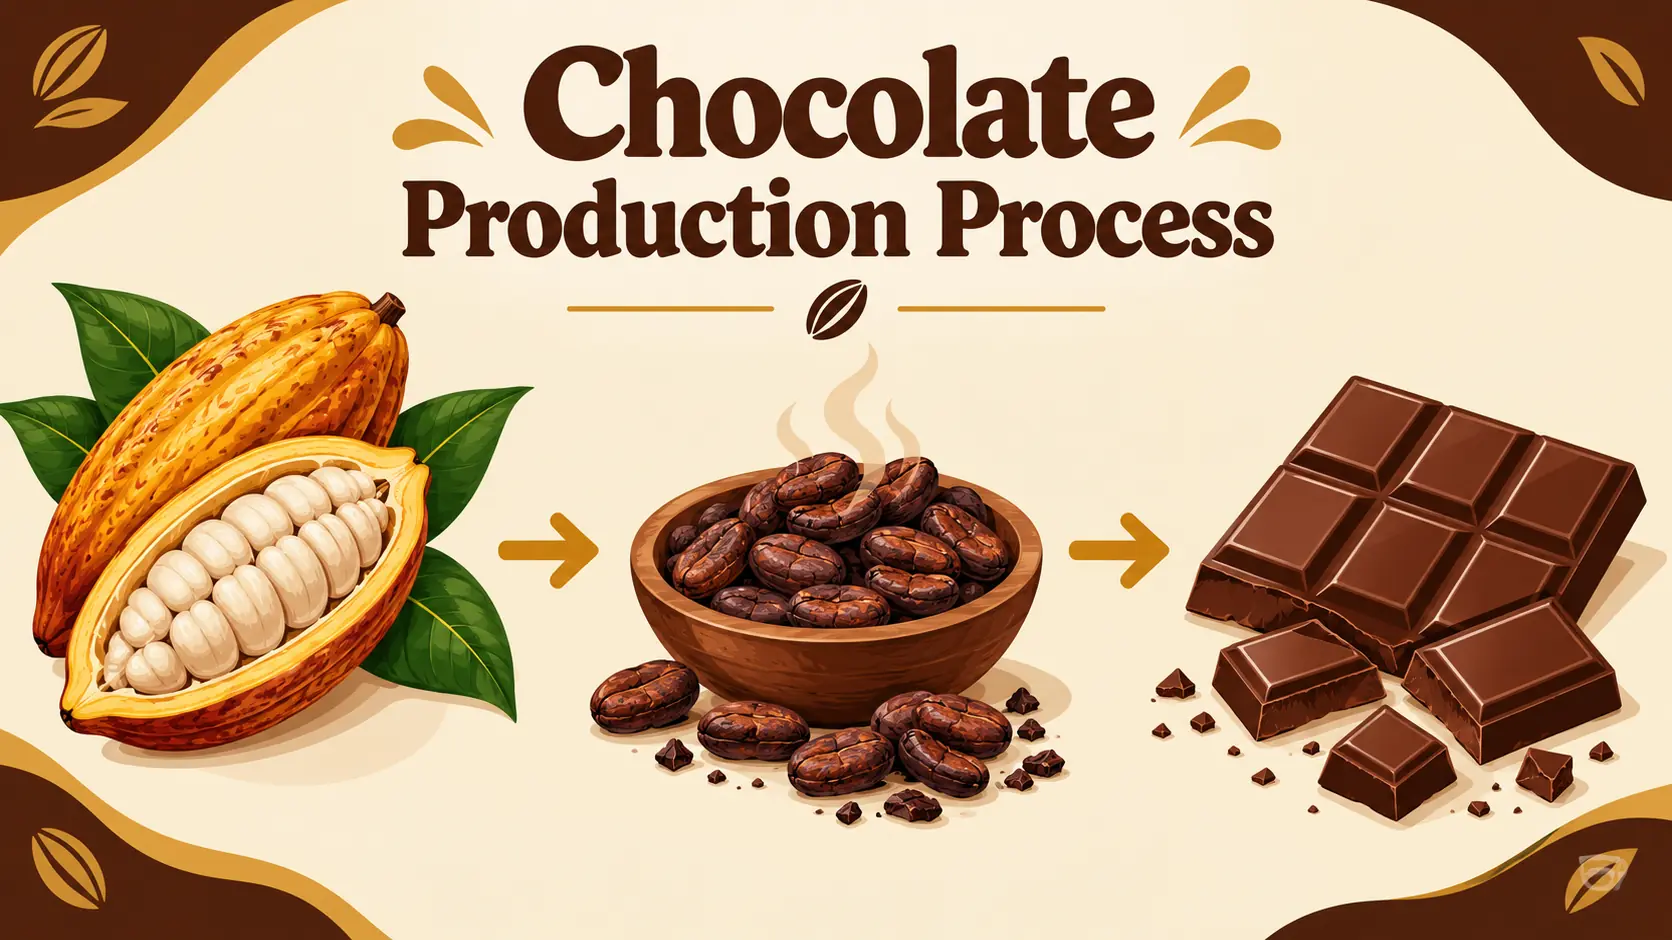
From Cacao Pod to Chocolate Bar: Production Process
How chocolate is made, step by step: from cacao pod harvest and fermentation to roasting, conching, and tempering, with global cocoa supply facts.
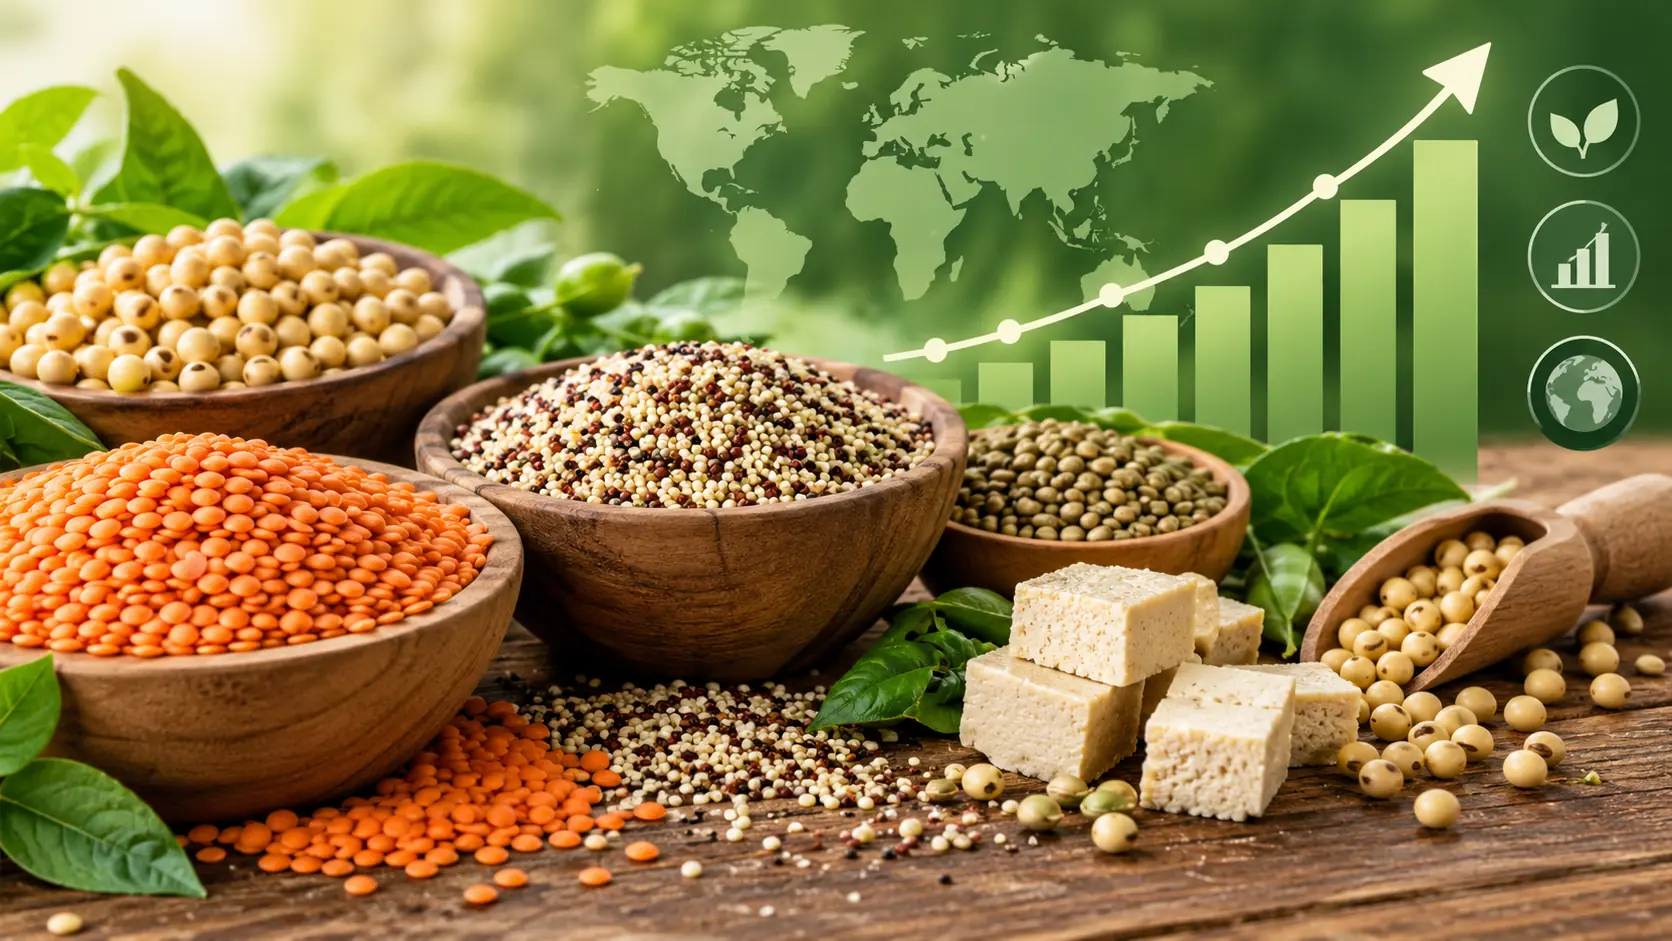
Plant-Based Protein Market Growth 2026
Plant-based protein market reaches $20.7B in 2026—pea vs soy, 44% US household penetration, fermentation investment, and LCA data.

Real Estate Infographics
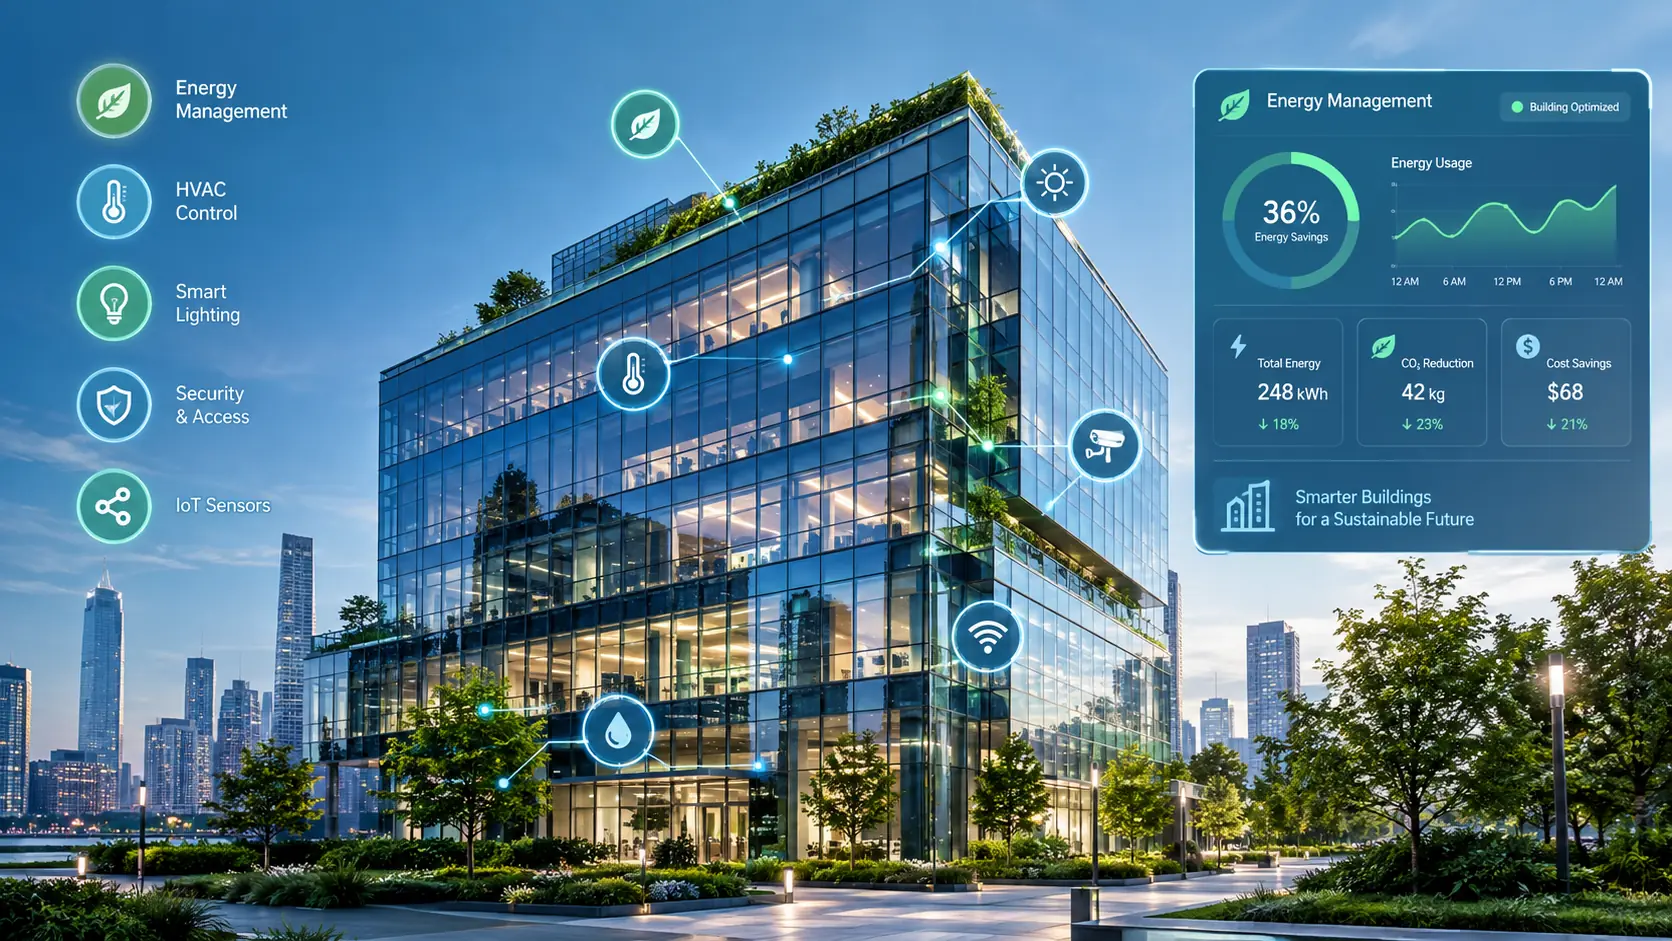
Smart Building Technology Market 2026
Smart buildings in 2026: $133B global market, 30–40% energy savings, 100–300 sensors per 10K sq ft, and 28% of Class A sites use digital twins.

Mortgage Rate Trends & Housing Affordability 2026
Mortgage rate data by country, housing affordability ratios, first-time buyer statistics, home price index trends, and buyer checklist for 2026.

Senior Living & Assisted Care Market Timeline 2026
Evolution of the senior care industry from 2000 to 2035: market size, occupancy rates, care technology adoption, staffing trends, and cost benchmarks.

Travel & Geography Infographics

First-Time Cruise Planning Checklist 2026
First-time cruise planning checklist for 2026: choose, book, prepare, and board, with cruise passenger data from CLIA and safety basics.

Medical Tourism Global Statistics 2026
Medical tourism is a $130B industry in 2026 with 20–25M cross-border patients—top destinations, procedure costs vs the US, and JCI quality standards.

Luxury Travel Market Guide 2026
Luxury travel market size, high-net-worth traveler preferences, top destinations, experiential tourism trends, and sustainable luxury travel data.

Science & Nature Infographics

Nuclear Fusion Energy: How It Works & Where It Stands
How nuclear fusion works, from deuterium-tritium reactions to tokamaks and lasers, plus milestones from NIF ignition, JET, and the ITER project.

Dark Matter & Dark Energy Guide 2026
About 95% of the universe is dark energy and dark matter; see 2026 detection methods, DESI, JWST, Rubin LSST, and particle candidates.

Coral Reef Ecosystem Decline Timeline & Conservation Data 2026
Coral reef decline data: 50% lost since 1950, mass bleaching events timeline, ocean acidification impact, restoration costs, and marine biodiversity loss.
Create Your Own Infographic
Don't see what you need? Generate a custom infographic on any topic in seconds.
Create Free Infographic