

Ecommerce Conversion Rate Optimization Checklist 2026 Infographic
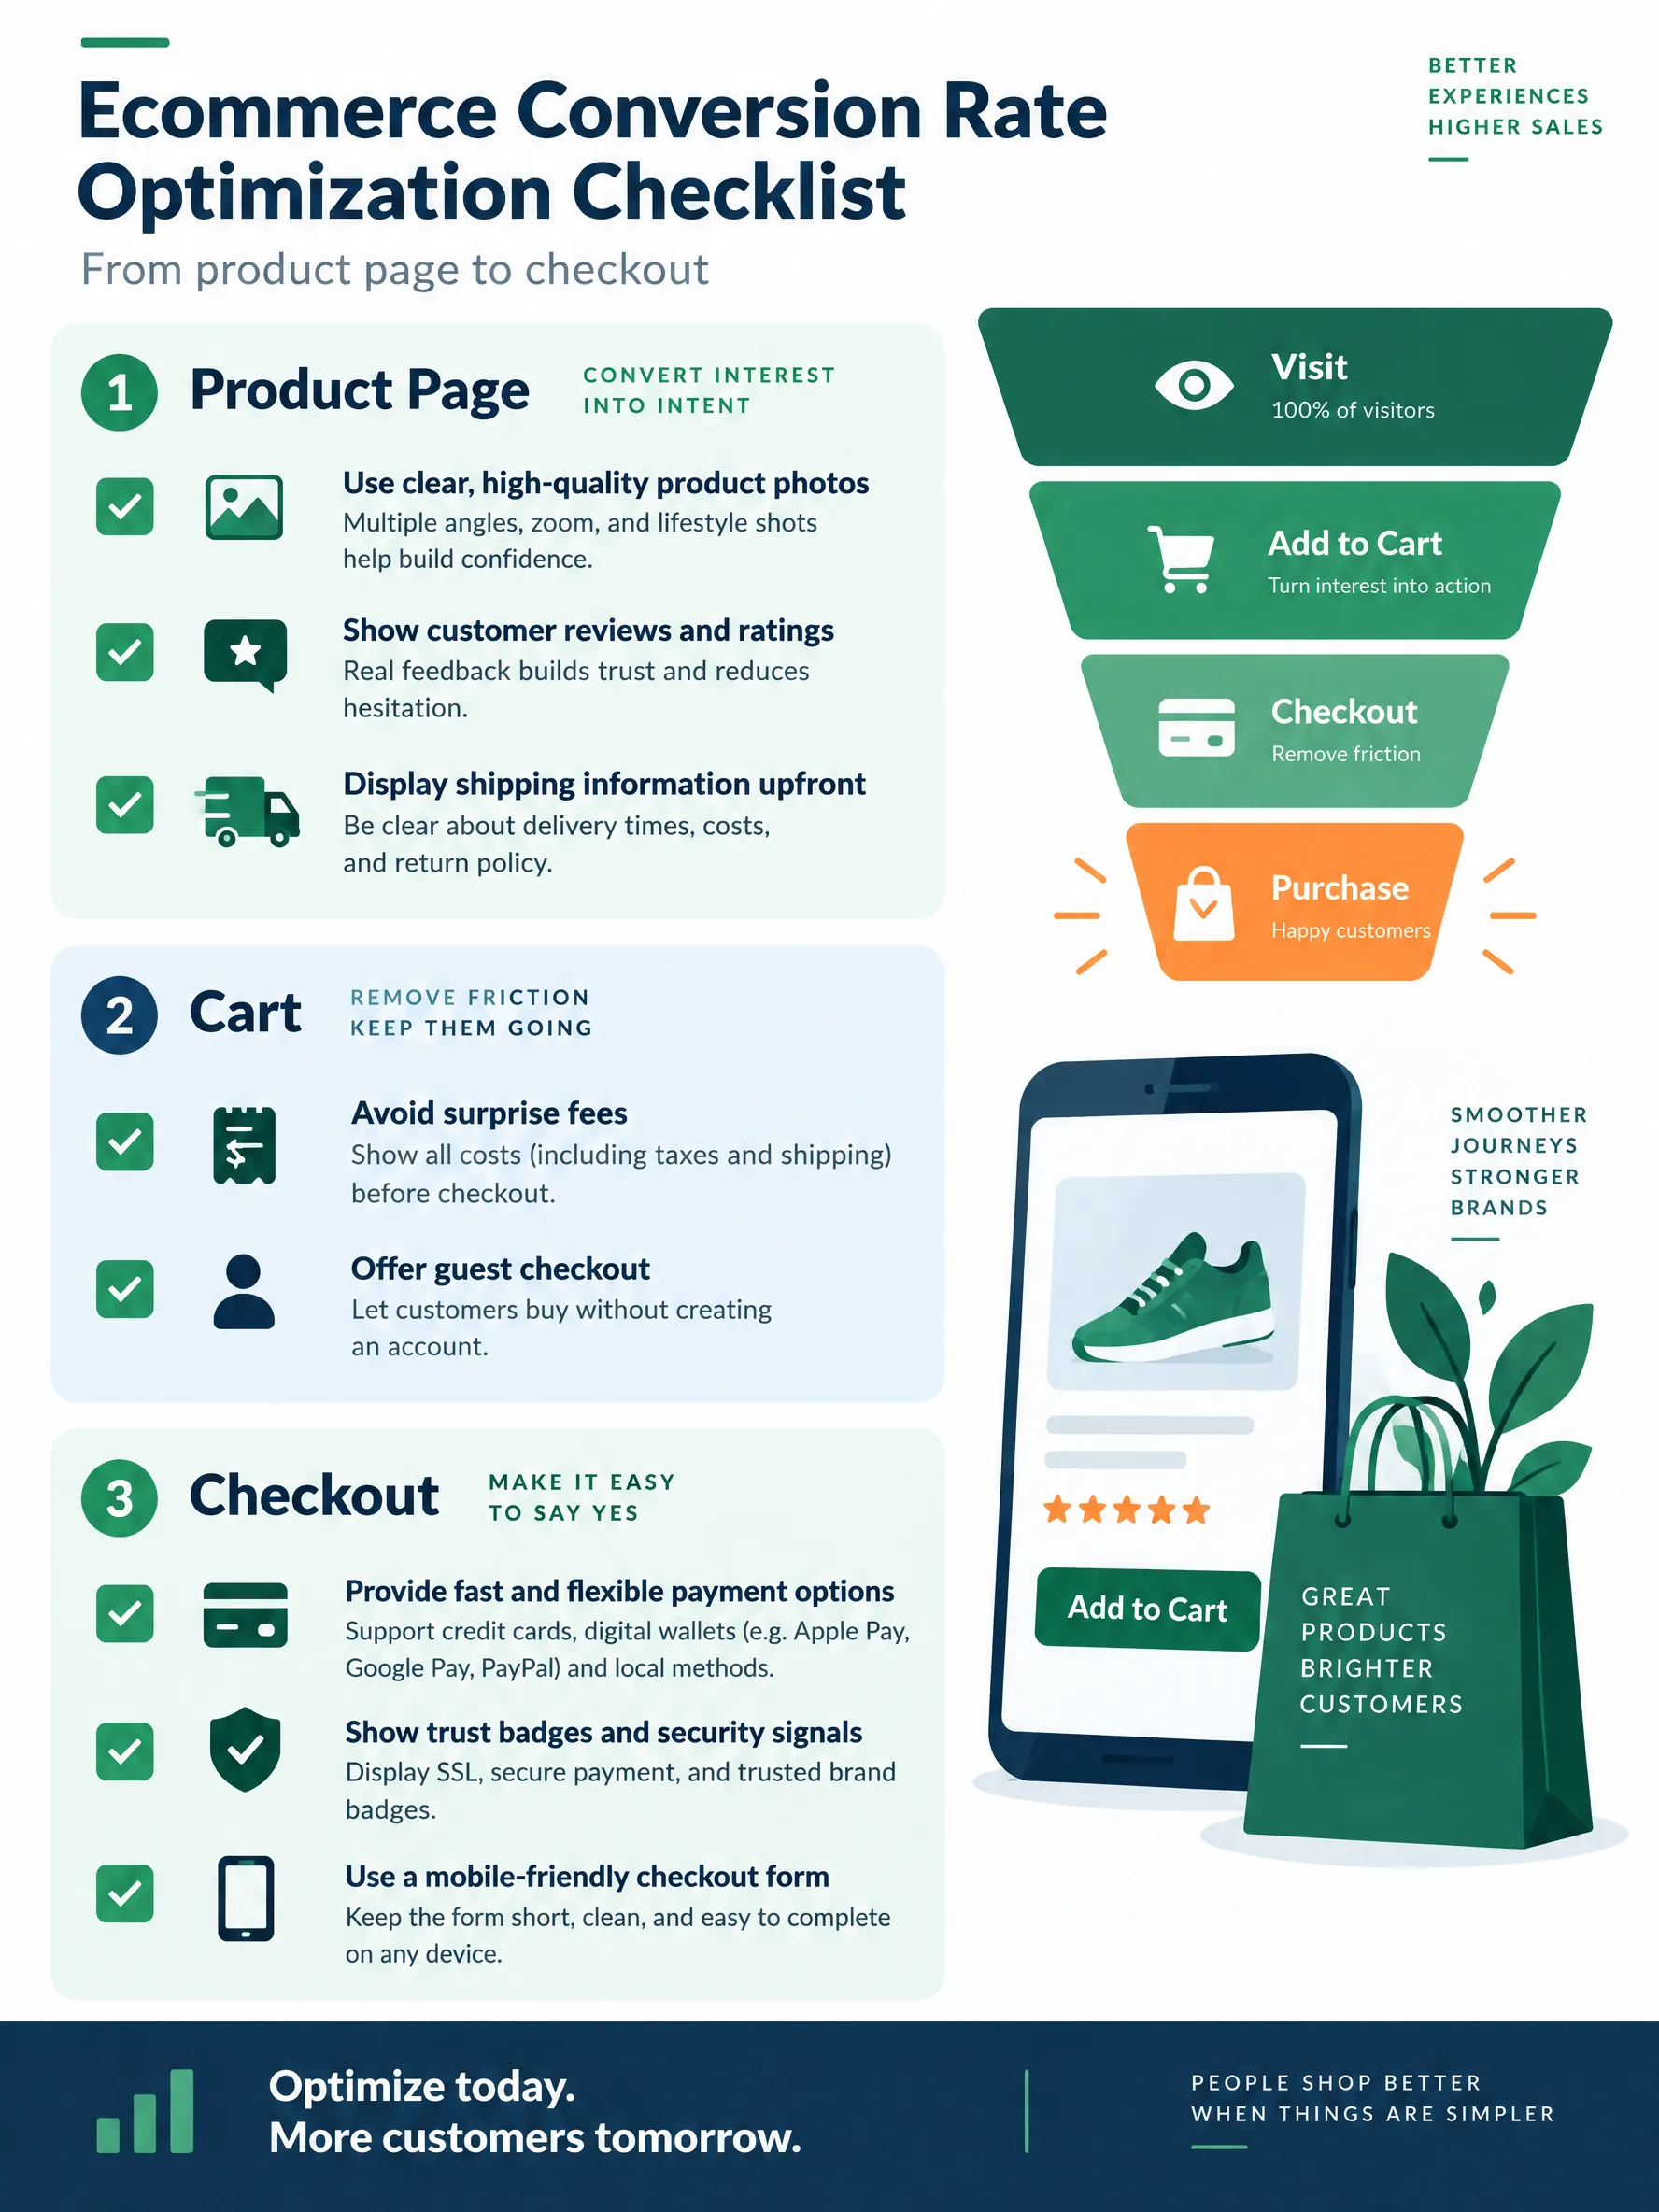
Ecommerce CRO checklist for 2026: fix product pages, cart, and checkout friction, using cart abandonment data from Baymard Institute research.
Published
Generate a custom version of this infographic
Customize with your own data, style, and branding
Generate This InfographicAction Items
Essential Ecommerce Conversion Rate Optimization Checklist 2026
Conversion rate optimization is the practice of turning more of your existing visitors into buyers instead of paying for more traffic. For most online stores the biggest leaks are not mysterious: shoppers leave when prices feel uncertain, when the site asks too much of them, or when they do not trust the checkout. The Baymard Institute, which aggregates dozens of studies, puts the average documented cart abandonment rate at 70.22 percent, averaged across 50 studies. That means roughly seven in ten shoppers who add something to the cart never finish. Not every lost cart is recoverable, since Baymard's own survey finds that 42 percent of US shoppers who abandoned were just browsing or not ready to buy, but each fixable friction point is still a direct revenue opportunity.
Start with the product page, because every later step depends on it. Show several clear photos from different angles, ideally with a zoom or short video, and write a description that answers the questions a customer would ask in a physical store: size, material, compatibility, and what is in the box. Put shipping cost and delivery estimates near the buy button rather than hiding them until checkout. Display real reviews, including mixed ones, since a page with only five-star praise looks suspicious. Make the primary button impossible to miss on mobile, where thumb reach and screen space decide whether a tap happens.
Speed is part of the product experience. Google's mobile research found that 53 percent of visits are abandoned when a page takes longer than three seconds to load. That study is several years old and mobile networks have improved, but the lesson holds: compress images, defer heavy scripts, and test your top landing pages on a mid-range phone with a normal connection instead of a developer laptop. Faster pages also help search visibility and paid campaign quality scores, so the gain compounds.
The cart is where surprise costs do the most damage. Baymard's latest survey of US shoppers shows that, once you set aside people who were just browsing, unexpected extra costs such as shipping, taxes, and fees are the leading reason for abandonment, cited by 40 percent. The checklist answer is simple: show a full cost estimate early, offer free shipping thresholds only if you can sustain them, and let people see the total before they enter personal data. Keep the cart editable, preserve it across devices for logged-in users, and avoid pushing upsells that distract from the main path to payment.
Checkout should feel short, safe, and flexible. Baymard reports that 18 percent of these shoppers abandon because a site forces them to create an account, so offer guest checkout and invite account creation after the purchase. Another 17 percent leave because the process feels too long or complicated, so remove optional fields, autofill addresses where possible, and show progress clearly. Offer the payment methods your customers actually use, including wallets and local options, and display recognizable security cues next to card fields. Test error messages too: vague validation errors on mobile are a quiet conversion killer.
Measurement keeps the checklist honest. Track funnel steps separately for mobile and desktop and for new and returning visitors, because a blended average hides the segment that is actually failing. Change one thing at a time and run A/B tests long enough to cover at least one full business cycle, usually two weeks or more, before declaring a winner. Pair numbers with qualitative evidence such as session recordings, customer support tickets, and post-purchase surveys, which often reveal problems that analytics only hint at.
Finally, prioritize by impact and effort. Fixing a shipping cost surprise or adding guest checkout usually takes days and can move results more than a full redesign. Use the checklist in this infographic as a quarterly audit: work from product page to cart to checkout, record the friction you find, and rank each fix by expected lift and engineering cost. A steady cycle of small, verified improvements beats an occasional big relaunch that nobody can measure.
Frequently Asked Questions
What is a good ecommerce conversion rate?
What is the biggest reason shoppers abandon their carts?
Should I offer guest checkout?
How long should I run an A/B test on my store?
Does page speed really affect conversions?
Sources
- Baymard Institute, Cart Abandonment Rate Statistics, 2026
- Baymard Institute, Checkout Usability Research, 2025
- Think with Google, The Need for Mobile Speed, 2016
Source links go to each publisher's official website.
Embed This Infographic
Copy the code below to share this infographic on your website
<a href="https://www.makeinfographics.ai/infographic/ecommerce-conversion-rate-optimization-checklist-2026" target="_blank" rel="noopener">
  <img src="https://pic-cdn.chibistyle.app/infographics/infographics/ecommerce-cro-checklist-2026.webp"
       alt="Ecommerce Conversion Rate Optimization Checklist 2026 — Ecommerce CRO checklist for 2026: fix product pages, cart, and checkout friction, using cart abandon"
       width="960" height="1280" loading="lazy"
       style="max-width:100%;height:auto;" />
</a>
<p>Source: <a href="https://www.makeinfographics.ai">MakeInfographics.ai</a> — Free AI Infographic Generator</p>
Create Your Own Ecommerce Conversion Rate Optimization Checklist 2026 Infographic
Customize this topic with your own data, style, and branding
Create Custom Version — FreeRelated Infographics
All E-Commerce infographics →E-Commerce Returns & Reverse Logistics Statistics 2026
Returns data: $820B annual return volume, return rates by category, environmental impact, reverse logistics costs, and restocking technology trends.
Cross-Border E-Commerce Growth Statistics 2026
Cross-border e-commerce reached $2.1T in 2026 (22% of online sales); 2.3B shoppers bought abroad, with 73% of orders on mobile.
Voice Commerce & Smart Shopping Statistics 2026
Voice commerce data: $164B market, smart speaker adoption, shopping category breakdown, conversion metrics, and consumer trust analysis.
Cross-Border E-Commerce Logistics 2026
Cross-border e-commerce hit $1.6T in 2026 (22% of online sales): customs stages, de minimis limits, DDP vs DAP, and AI HS codes.