

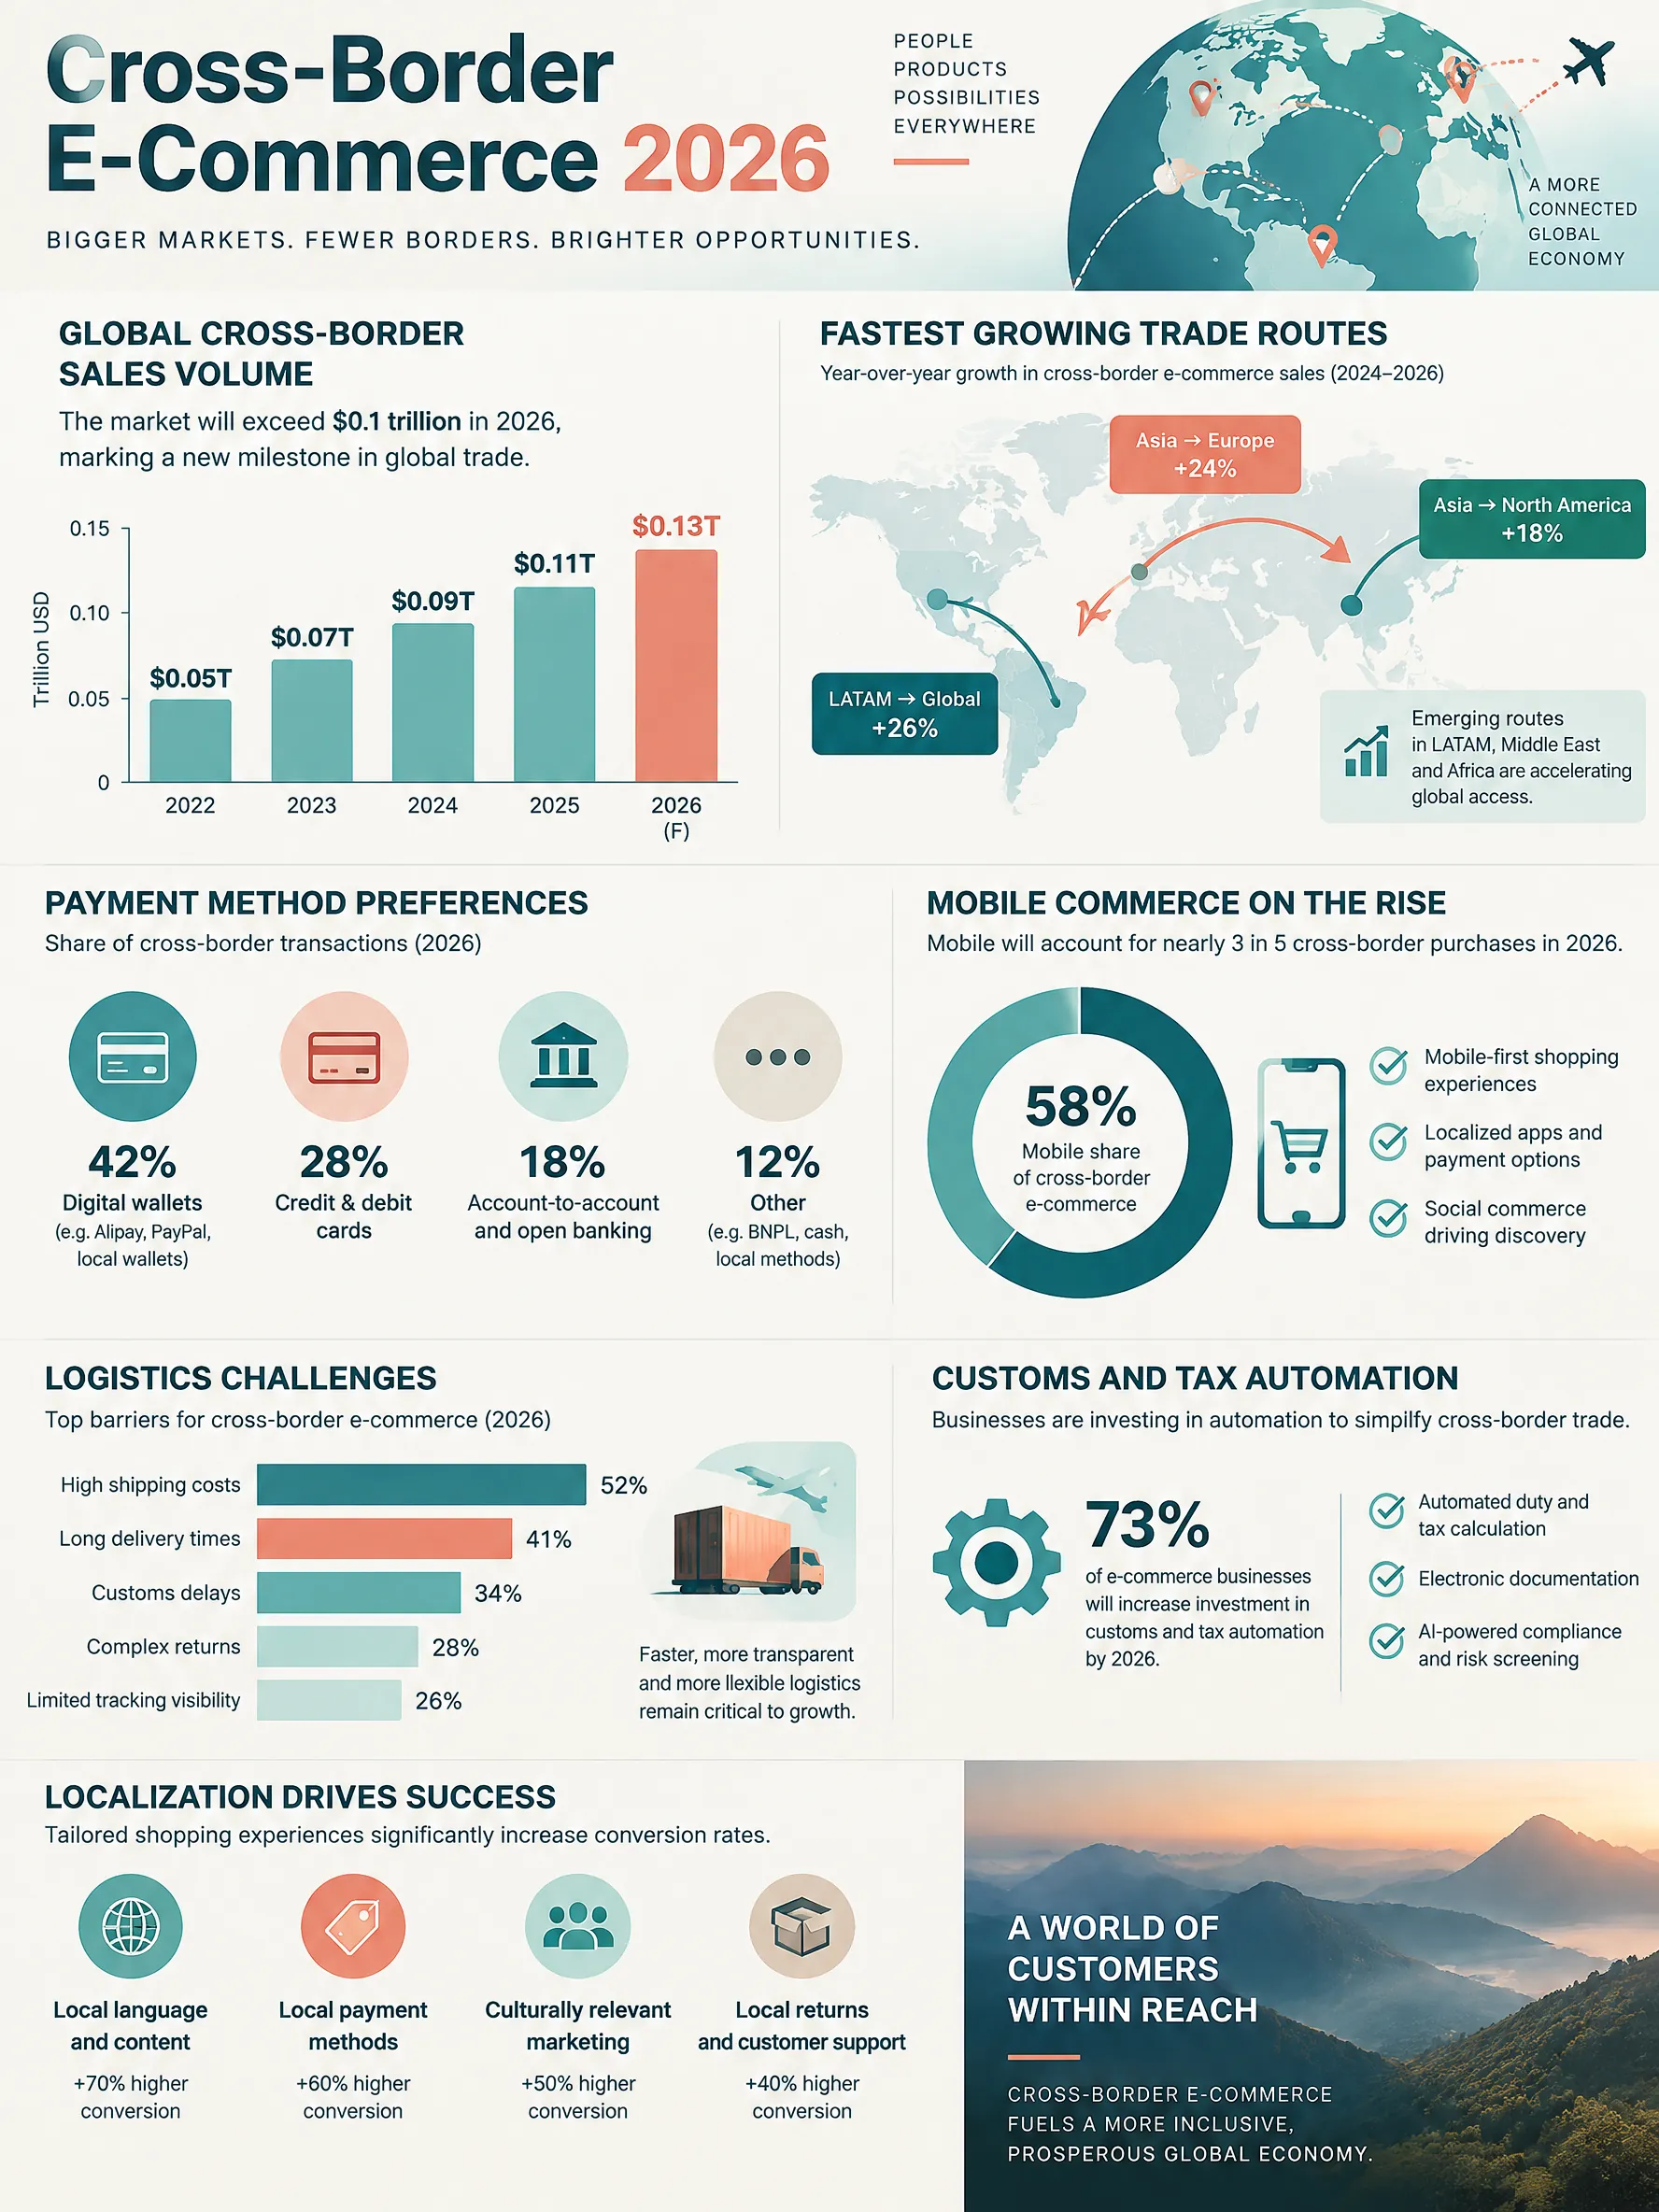
Cross-Border E-Commerce Growth Statistics 2026 Infographic
Cross-border ecommerce data for 2026: global market exceeding $2.1 trillion, top trade corridors, mobile commerce trends, payment localization, and logistics automation statistics.
Published · Updated
Generate a custom version of this infographic
Customize with your own data, style, and branding
Generate This InfographicKey Statistics
- 1Global cross-border e-commerce market reached $2.1 trillion in 2026, 22% of total e-commerce (eMarketer, 2026)
- 22.3 billion consumers made at least one cross-border online purchase in 2026 (Statista, 2026)
- 3China cross-border e-commerce platforms processed $380 billion in GMV (China Commerce Ministry, 2026)
- 4Mobile commerce accounts for 73% of cross-border transactions (PayPal Cross-Border Report, 2026)
- 5Local payment methods increase cross-border conversion rates by 35% (Adyen Payment Insights, 2026)
- 6Southeast Asia cross-border purchases grew 42% YoY (Google/Temasek/Bain e-Conomy Report, 2026)
- 7DDP solutions adopted by 55% of major cross-border merchants, reducing cart abandonment by 25% (Digital Commerce 360, 2026)
- 8Amazon's international marketplace sellers exceeded 2 million active cross-border businesses in 2026 (Amazon, 2026)
- 9The 2020 pandemic accelerated cross-border e-commerce growth by 27% in a single year (UNCTAD, 2021)
- 10Temu and SHEIN achieved $50 billion combined revenue by 2024 disrupting traditional retail (Bloomberg, 2025)
About Cross-Border E-Commerce Growth Statistics 2026
Cross-border e-commerce has grown into a $2.1 trillion market in 2026, representing 22 percent of total global e-commerce sales. The acceleration is driven by improved logistics infrastructure, payment localization technology, and consumer demand for products not available in domestic markets. Over 2.3 billion consumers made at least one cross-border online purchase in 2026, with average cross-border order values 15 percent higher than domestic orders.
Asia-Pacific dominates cross-border e-commerce flows. China remains the largest exporter, with Temu, Shein, AliExpress, and TikTok Shop collectively processing $380 billion in cross-border GMV. Southeast Asia is the fastest-growing import market, with cross-border purchases growing 42 percent year-over-year in Indonesia, Thailand, and the Philippines. Europe-to-North America and North America-to-Europe corridors each exceed $120 billion annually, driven by fashion, beauty, and specialty food categories.
Mobile commerce accounts for 73 percent of cross-border transactions, compared to 62 percent for domestic e-commerce. Social commerce platforms, particularly TikTok Shop and Instagram Shopping, now drive 18 percent of cross-border discovery and purchase. Live-stream shopping has expanded beyond Asia, with cross-border live commerce reaching $45 billion globally. Payment localization is critical — merchants offering local payment methods (Pix in Brazil, iDEAL in Netherlands, GrabPay in SEA) see 35 percent higher conversion rates than those offering only credit cards.
Logistics and customs automation have dramatically reduced friction. AI-powered harmonized tariff classification reduces customs delays by 60 percent. Delivered-duty-paid (DDP) solutions that calculate and collect duties at checkout have been adopted by 55 percent of major cross-border merchants, eliminating surprise fees that historically caused 25 percent cart abandonment. Cross-border fulfillment networks — overseas warehouses pre-stocked with fast-moving inventory — now deliver 3-5 day shipping on 40 percent of cross-border orders, approaching domestic delivery speeds.
Frequently Asked Questions
How big is the cross-border e-commerce market?
What are the biggest challenges in cross-border e-commerce?
Which markets are growing fastest in cross-border e-commerce?
Which products sell best across borders?
Sources
- eMarketer, Global Cross-Border E-Commerce Forecast, 2026
- PayPal, Cross-Border Commerce Report, 2026
- Google/Temasek/Bain, e-Conomy SEA Report, 2026
- Adyen, Global Payment Method Insights, 2026
- Digital Commerce 360, Cross-Border Fulfillment Report, 2026
- Juniper Research, Cross-Border E-Commerce Market Report, 2026
- UNCTAD, Digital Economy Report, 2026
Source links go to each publisher's official website.
Embed This Infographic
Copy the code below to share this infographic on your website
<a href="https://www.makeinfographics.ai/infographic/cross-border-ecommerce-growth-statistics-2026" target="_blank" rel="noopener">
  <img src="https://www.makeinfographics.ai/images/infographics/cross-border-ecommerce.webp"
       alt="Cross-Border E-Commerce Growth Statistics 2026 — Cross-border ecommerce data for 2026: global market exceeding $2.1 trillion, top trade corridors, mo"
       width="960" height="1280" loading="lazy"
       style="max-width:100%;height:auto;" />
</a>
<p>Source: <a href="https://www.makeinfographics.ai">MakeInfographics.ai</a> — Free AI Infographic Generator</p>
Create Your Own Cross-Border E-Commerce Growth Statistics 2026 Infographic
Customize this topic with your own data, style, and branding
Create Custom Version — FreeRelated Infographics
All E-Commerce infographics →Supply Chain Management Overview
Modern supply chain management: procurement, logistics, inventory optimization, digital twin technology, and resilience strategies for 2026.
Digital Payment Methods: A Complete Guide for E-Commerce in 2026
Explore the leading digital payment methods transforming e-commerce in 2026 — from mobile wallets and BNPL to cryptocurrency and real-time payments — with adoption data and implementation tips.
DTC E-Commerce Brand Trends 2026
Timeline of direct-to-consumer brand evolution from 2010 to 2026, covering market growth, customer acquisition shifts, social commerce, subscription models, and fulfillment innovation.
Global Pet Care Industry Statistics 2026
Complete overview of the $350 billion global pet care market covering ownership rates, spending categories, pet health trends, and emerging pet-tech innovations.