

Fast Fashion vs Sustainable Fashion 2026 Infographic
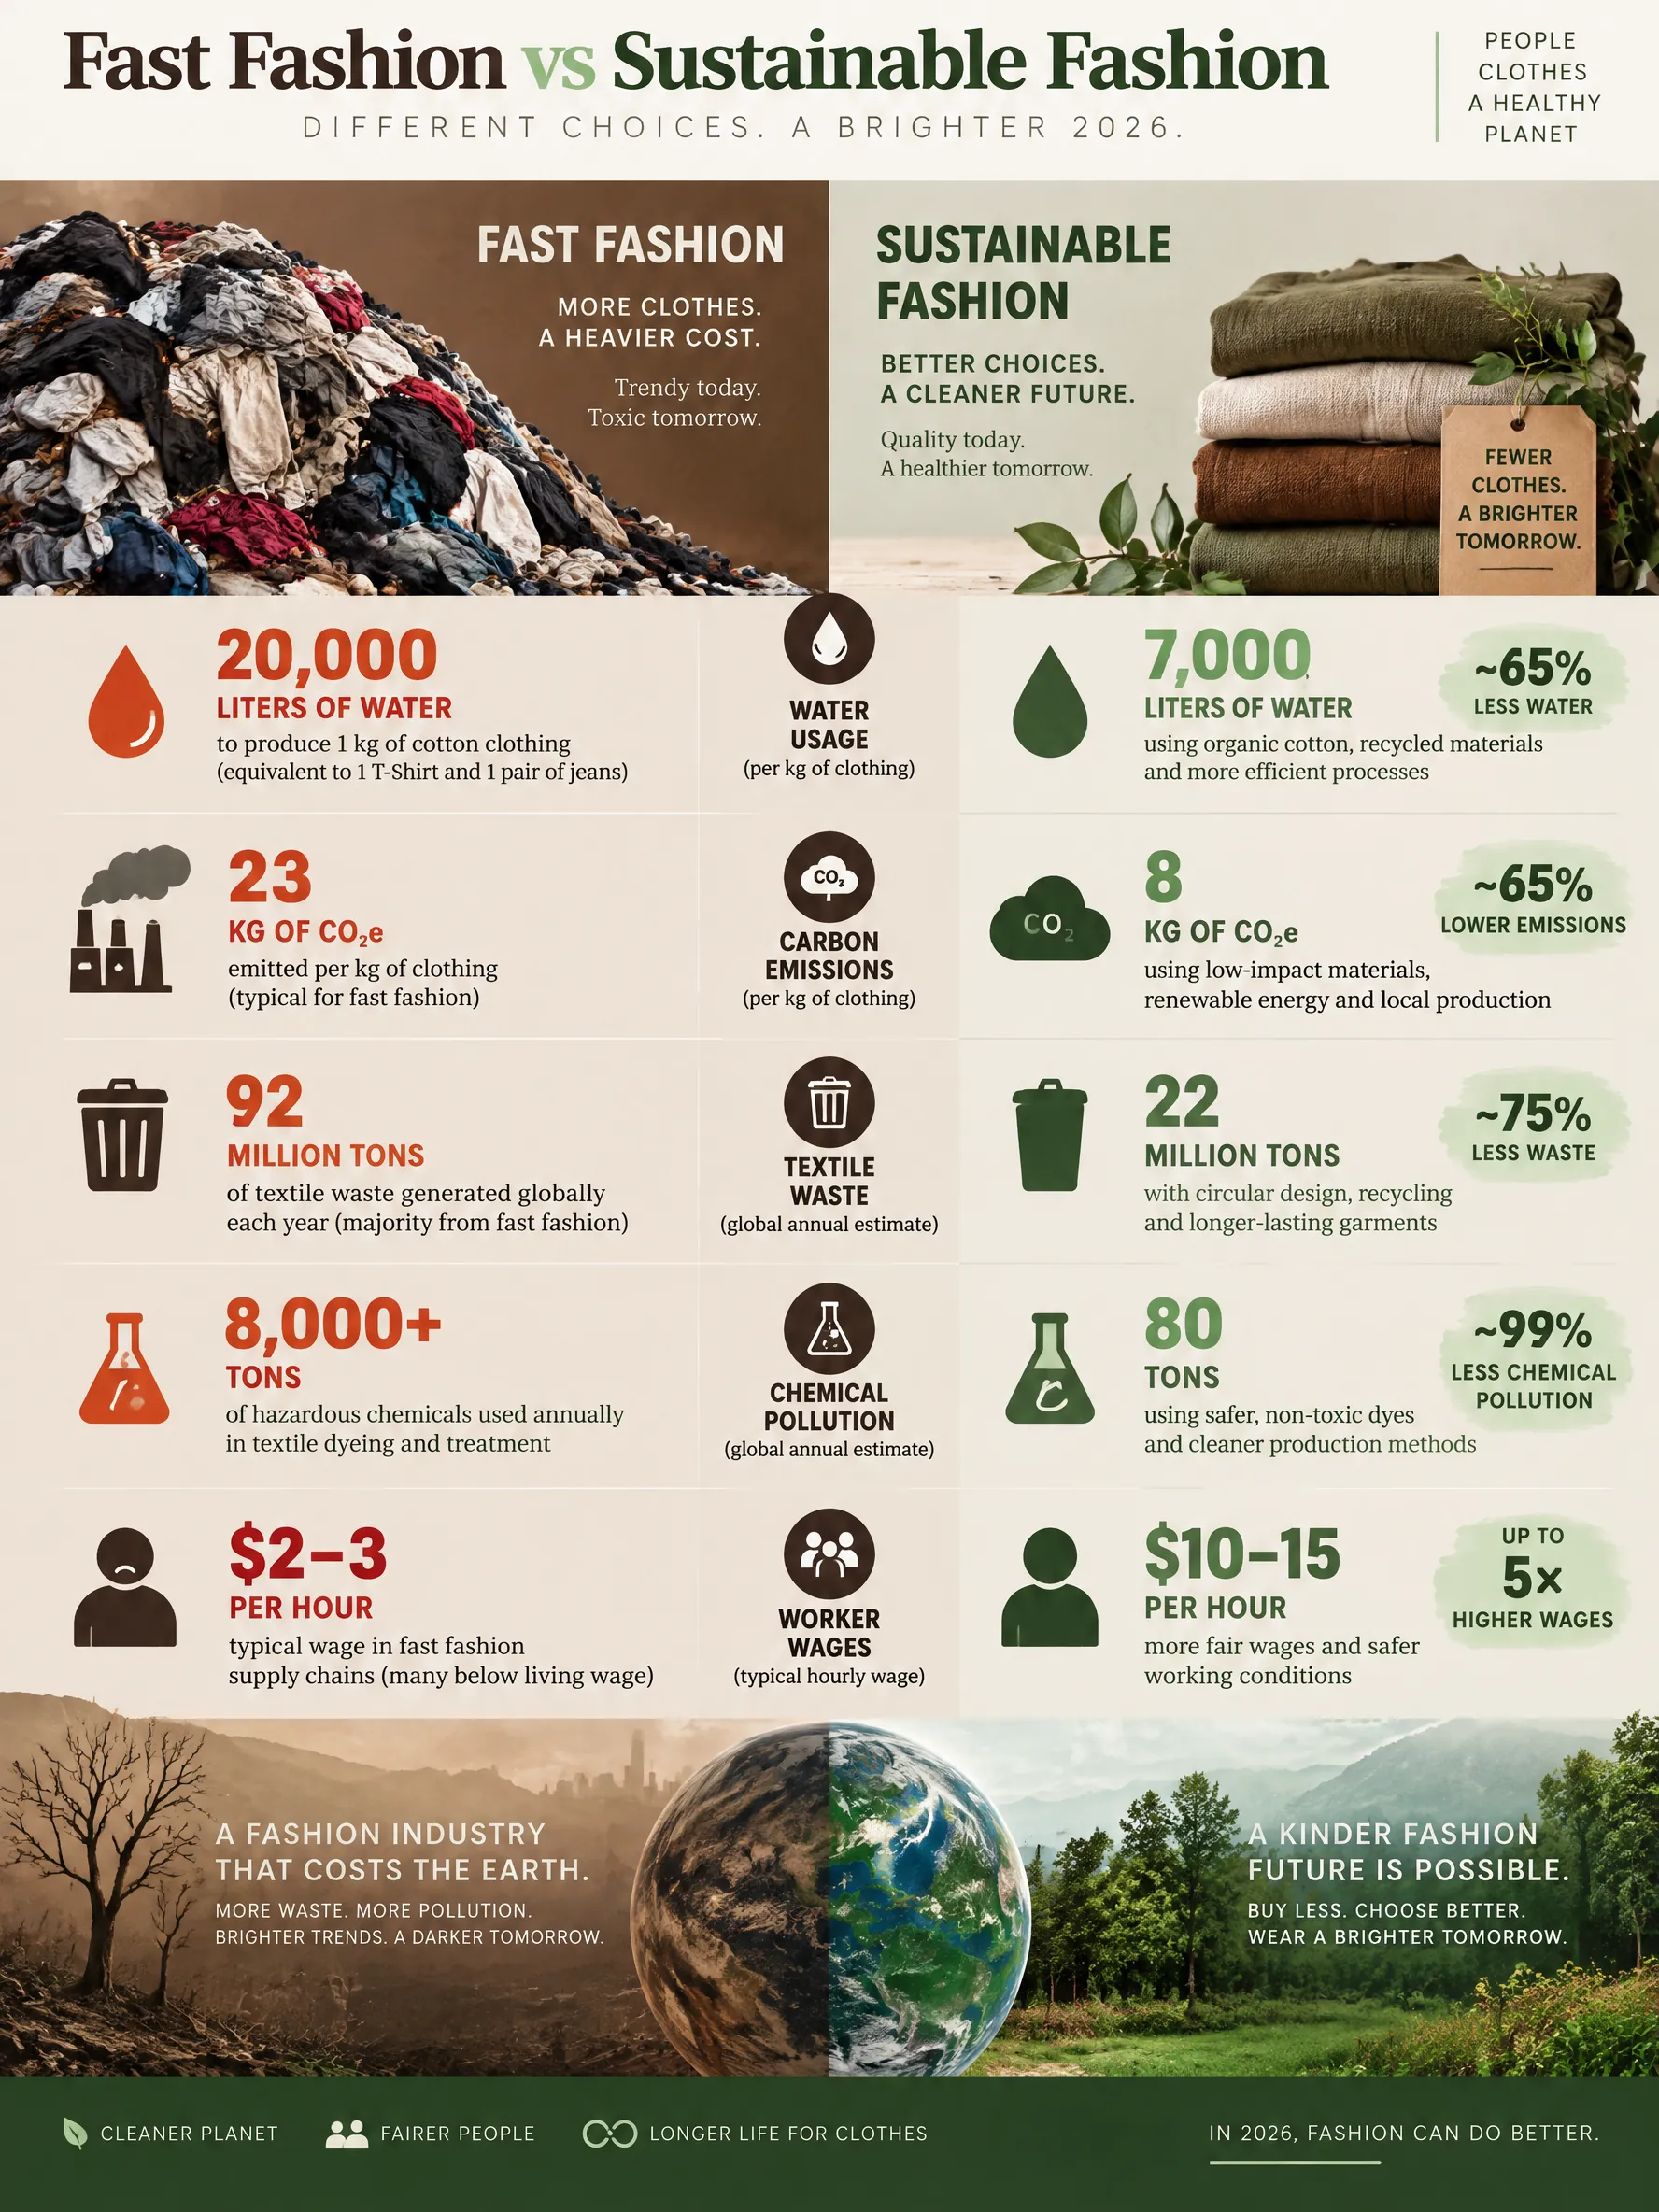
Environmental impact comparison of fast fashion versus sustainable fashion: water usage, carbon emissions, textile waste, worker conditions, and consumer behavior data.
Published
Generate a custom version of this infographic
Customize with your own data, style, and branding
Generate This InfographicKey Comparisons
Comparing Fast Fashion vs Sustainable Fashion 2026
The fashion industry stands as one of the world's most polluting sectors, responsible for 8-10% of global carbon emissions — more than international flights and maritime shipping combined. In 2026, the contrast between fast fashion's environmental toll and sustainable fashion's growing alternatives has never been clearer. This comparison examines the two models across multiple dimensions: environmental impact, resource consumption, labor conditions, consumer economics, and scalability.
Water consumption reveals dramatic differences. Producing a single conventional cotton t-shirt requires approximately 2,700 liters of water — enough drinking water for one person for 2.5 years. A pair of jeans demands 7,500 liters. Fast fashion's annual water footprint exceeds 79 billion cubic meters globally. Sustainable alternatives show measurable improvements: organic cotton reduces water use by 71% through rain-fed farming practices, recycled polyester eliminates the water-intensive virgin production process entirely, and innovative materials like Tencel (lyocell) use a closed-loop system recovering 99% of water and solvents.
Carbon emissions follow similar patterns. The fast fashion industry emits 1.2 billion tons of CO2 equivalent annually. A typical fast fashion garment generates 33.4 kg of CO2 across its lifecycle — from raw material extraction through manufacturing, transportation, retail, and disposal. Sustainable fashion brands implementing low-carbon practices achieve 30-50% reductions: using renewable energy in manufacturing, nearshoring production to reduce transport emissions, selecting lower-impact materials, and designing for longevity. Resale and rental models extend garment life by 2-3x, effectively halving per-wear emissions.
Textile waste statistics are particularly alarming. The world produces 92 million tons of textile waste annually, equivalent to a garbage truck of clothes dumped every second. Only 12% of discarded clothing is recycled; 87% ends up in landfills or incinerators. The average consumer now buys 60% more clothing than in 2000 but keeps each garment for half as long. In contrast, sustainable fashion emphasizes durability and timelessness: premium sustainable brands report garment lifespans of 3-5 years versus 7-10 wears for fast fashion items before disposal. The resale market grew to $218 billion in 2026, led by platforms like ThredUp, Vestiaire Collective, and Depop.
Labor conditions present the starkest contrast. Fast fashion supply chains employ an estimated 75 million garment workers globally, with many in Bangladesh, Vietnam, Cambodia, and Myanmar earning below living wages ($2-5 per day). Workplace safety incidents continue despite post-Rana Plaza reforms. Certified sustainable manufacturers (Fair Trade, SA8000) ensure living wages, safe conditions, and worker organizing rights, though certified production accounts for only 3% of global output. Consumer willingness to pay more for ethical fashion reached 68% in 2026 surveys, but actual purchasing behavior shows only 18% consistently choose sustainable options when price differences exceed 20%.
Frequently Asked Questions
What is fast fashion and why is it harmful?
How can consumers shift to sustainable fashion?
Is sustainable fashion more expensive?
Sources
- United Nations Environment Programme (UNEP), Fashion and Sustainability Report, 2026
- Ellen MacArthur Foundation, A New Textiles Economy, 2025
- Textile Exchange, Preferred Fiber & Materials Market Report, 2026
- ThredUp, Annual Resale Report, 2026
- International Labour Organization (ILO), Garment Industry Working Conditions, 2025
Source links go to each publisher's official website.
Embed This Infographic
Copy the code below to share this infographic on your website
<a href="https://www.makeinfographics.ai/infographic/fast-fashion-environmental-impact-2026" target="_blank" rel="noopener">
  <img src="https://www.makeinfographics.ai/images/infographics/fast-fashion-impact.webp"
       alt="Fast Fashion vs Sustainable Fashion 2026 — Environmental impact comparison of fast fashion versus sustainable fashion: water usage, carbon emis"
       width="960" height="1280" loading="lazy"
       style="max-width:100%;height:auto;" />
</a>
<p>Source: <a href="https://www.makeinfographics.ai">MakeInfographics.ai</a> — Free AI Infographic Generator</p>
Create Your Own Fast Fashion vs Sustainable Fashion 2026 Infographic
Customize this topic with your own data, style, and branding
Create Custom Version — FreeRelated Infographics
All Sustainability & ESG infographics →Climate Change Statistics
Key climate data visualized: 1.2°C warming since pre-industrial times, record CO2 levels, ice sheet loss, and accelerating renewable energy adoption.
Renewable Energy Sources Comparison
Compare solar, wind, hydro, geothermal, and biomass: levelized cost per kWh, capacity factors, emissions, and 2030 growth projections.
Global Water Crisis and Water Scarcity Statistics
Visualize the global water crisis: 2.2 billion people lack safe drinking water, agriculture consumes 70% of freshwater, and 80% of wastewater is untreated. Key data on water stress, access, and solutions.
Circular Economy & Zero Waste Statistics 2026
Key data on waste generation, recycling rates, circular economy market growth, plastic pollution, food waste, and fast fashion's environmental impact across countries.