

Climate Change Statistics Infographic
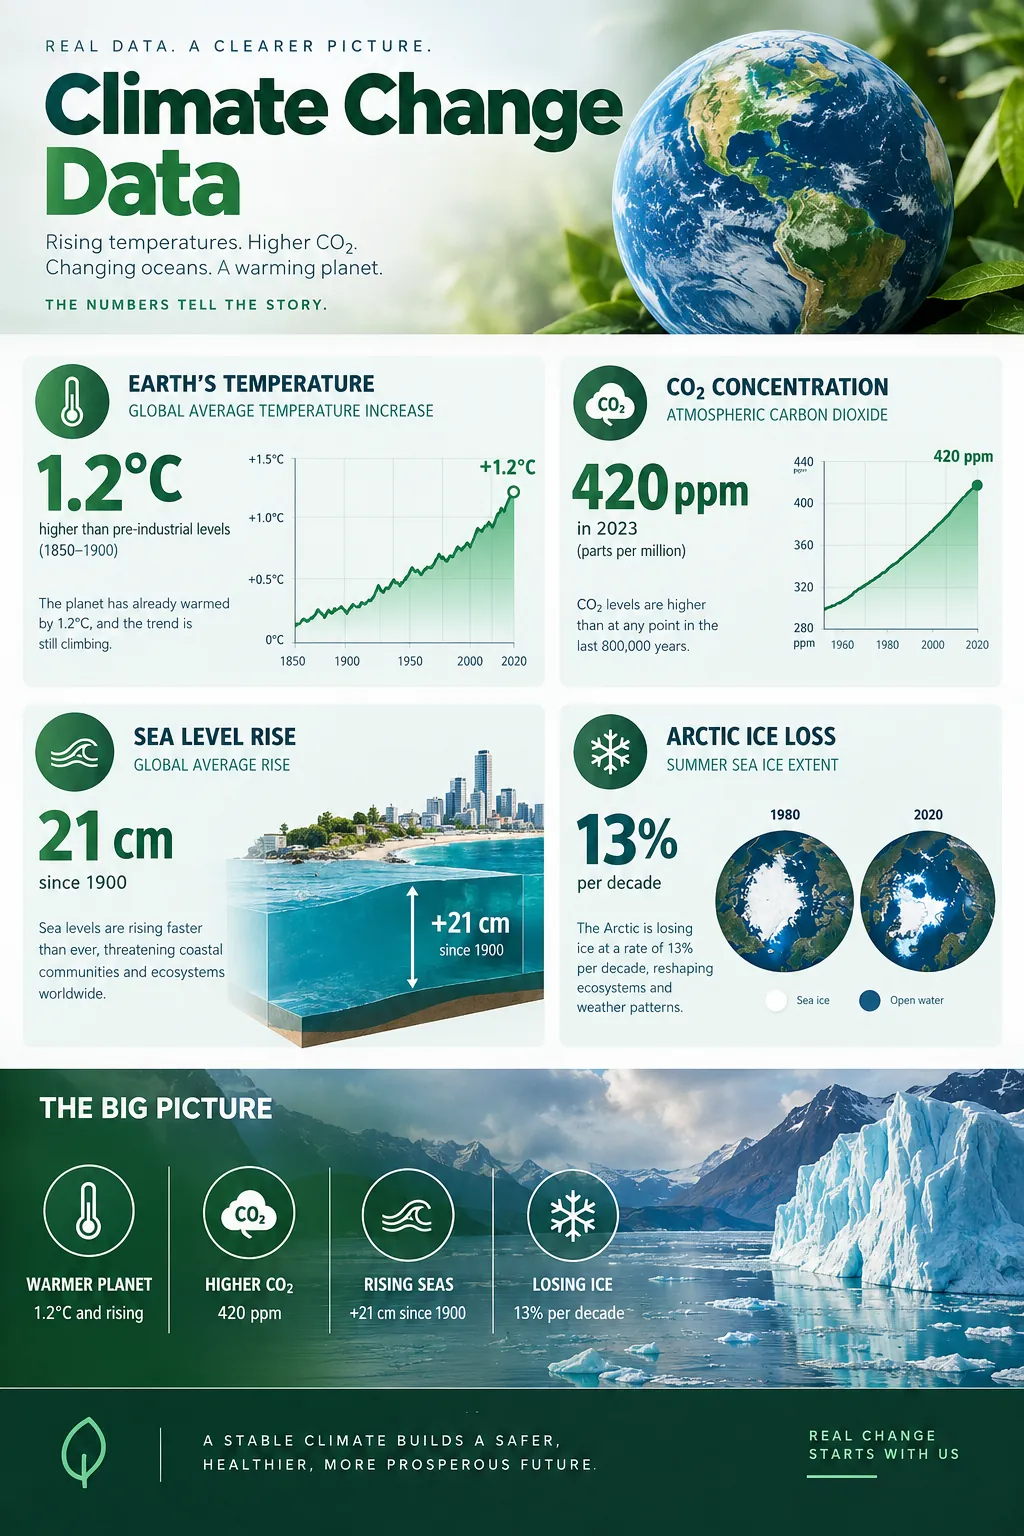
Key climate data visualized: 1.2°C warming since pre-industrial times, record CO2 levels, ice sheet loss, and accelerating renewable energy adoption.
Published
Generate a custom version of this infographic
Customize with your own data, style, and branding
Generate This InfographicKey Comparisons
Comparing Climate Change Statistics
Climate change represents one of the most extensively documented environmental shifts in human history, supported by decades of satellite observations, ice core samples, and ocean temperature records. Global average surface temperature has risen approximately 1.2 degrees Celsius above pre-industrial levels, with the last decade recording the ten warmest years on record. Atmospheric CO2 concentrations exceeded 420 parts per million in 2024, the highest level in at least 800,000 years
The Arctic is warming nearly four times faster than the global average, accelerating ice sheet melt in Greenland and Antarctica. Sea levels have risen roughly 20 centimeters since 1900, threatening coastal communities that house over 600 million people worldwide. Ocean acidification has increased 30 percent since pre-industrial times, disrupting marine ecosystems and coral reef systems that support fisheries and coastal economies
Extreme weather events including heatwaves, droughts, and intense hurricanes have increased in frequency and severity across every continent. At the same time, renewable energy capacity additions reached record highs, with solar and wind now accounting for over 30 percent of global electricity generation in leading markets. Methane emissions from thawing permafrost and agriculture represent a growing concern for long-term warming trajectories
These statistics underscore the urgency of emissions reduction while highlighting measurable progress in the clean energy transition.
Sector comparisons clarify why emissions trajectories diverge even when renewable electricity surges. Power grids in leading markets now generate more than 30 percent of electricity from wind and solar, yet transportation, industry, and agriculture still rely heavily on fossil fuels, so economy-wide CO2 can remain flat while clean generation sets records. Methane from energy production, livestock, and thawing permafrost adds short-term forcing that temperature targets cannot ignore, even if carbon dioxide dominates long-run stocks.
Regional impacts follow geography and income. Arctic amplification near four times the global average accelerates Greenland ice loss measured in hundreds of billions of tons annually in satellite eras, while low-lying coasts hosting more than 600 million people face compound risks from sea-level rise and storm surge. Small island states and arid regions experience disproportionate food and water stress when droughts lengthen.
Measurement limitations deserve attention. Single-year weather extremes do not prove trend shifts, but sustained increases in heat intensity align with thermodynamic expectations from higher baseline temperatures. Economic loss figures from reinsurance databases spike in bad years yet undercount uninsured damage in poorer nations, which biases global headlines toward wealthy markets.
Mitigation progress is real yet insufficient against Paris-aligned pathways. Capacity additions for renewables grow faster than a decade ago, but total emissions must peak and fall rapidly to limit additional warming beyond the roughly 1.2 degrees Celsius already observed since pre-industrial times. Adaptation finance, grid storage, and efficiency in buildings remain the complementary levers IPCC and IEA analyses emphasize for the late 2020s.
Ocean chemistry ties directly to atmospheric CO2. Surface waters have grown roughly 30 percent more acidic since industrialization began, stressing coral reefs and shell-forming species that support fisheries. Reducing deforestation complements energy transition because intact forests store carbon while preserving regional rainfall patterns. Policymakers increasingly treat climate metrics as interconnected balances rather than a single temperature number on a chart.
Adaptation complements mitigation because some change is already locked in. Coastal defenses, heat action plans, drought-resistant crops, and early-warning systems reduce harm today, and the cost of preparing is generally far lower than the cost of recovering from repeated disasters. Impacts fall unevenly: low-income and small-island communities contribute the least to emissions yet often face the greatest exposure, which is why finance and technology transfer remain central in international negotiations. Individual choices around energy, transport, and food matter at the margin, but policy, infrastructure, and corporate decisions determine most of the trajectory over the coming decades. Tracking indicators such as atmospheric concentrations, ocean heat content, and sea level over many years helps separate long-term trends from yearly variability.
Frequently Asked Questions
How much has the Earth warmed since pre-industrial times?
What are the main drivers of climate change?
Is renewable energy growing fast enough to offset emissions?
Which regions are most affected by climate change?
Sources
- Intergovernmental Panel on Climate Change (IPCC), 2023
- National Oceanic and Atmospheric Administration (NOAA), 2024
- International Energy Agency (IEA), 2024
- NASA Global Climate Change, 2024
Source links go to each publisher's official website.
Embed This Infographic
Copy the code below to share this infographic on your website
<a href="https://www.makeinfographics.ai/infographic/climate-change-statistics" target="_blank" rel="noopener">
  <img src="https://pic-cdn.chibistyle.app/infographics/infographics/climate-change.webp"
       alt="Climate Change Statistics — Key climate data visualized: 1.2°C warming since pre-industrial times, record CO2 levels, ice sheet "
       width="960" height="1440" loading="lazy"
       style="max-width:100%;height:auto;" />
</a>
<p>Source: <a href="https://www.makeinfographics.ai">MakeInfographics.ai</a> — Free AI Infographic Generator</p>
Create Your Own Climate Change Statistics Infographic
Customize this topic with your own data, style, and branding
Create Custom Version — FreeMake Something for Your Own Life
Free printable planners, blank or filled in by AI from your details.


Related Infographics
All Sustainability & ESG infographics →Carbon Capture Technology & Climate Solutions 2026
Carbon capture in 2026: 51 Mtpa operating capacity, DAC costs near $400–600/ton, $12.4B CCUS investment, and 45Q credits at $85–180/ton.
Fast Fashion vs Sustainable Fashion 2026
Fashion emits 8–10% of global CO2 and 92M tons of textile waste yearly. Compare fast vs sustainable models on water, labor, waste, and resale.
Microplastics: The Invisible Pollution Crisis 2026
Microplastics in oceans, soil, and blood: 14.4M tons on the seabed, ~5 g ingested weekly, tire wear at 28%, and 80+ nations curbing plastics.
Renewable Energy Sources Comparison
Compare solar, wind, hydro, geothermal, and biomass: levelized cost per kWh, capacity factors, emissions, and 2030 growth projections.