

Renewable Energy Sources Comparison Infographic
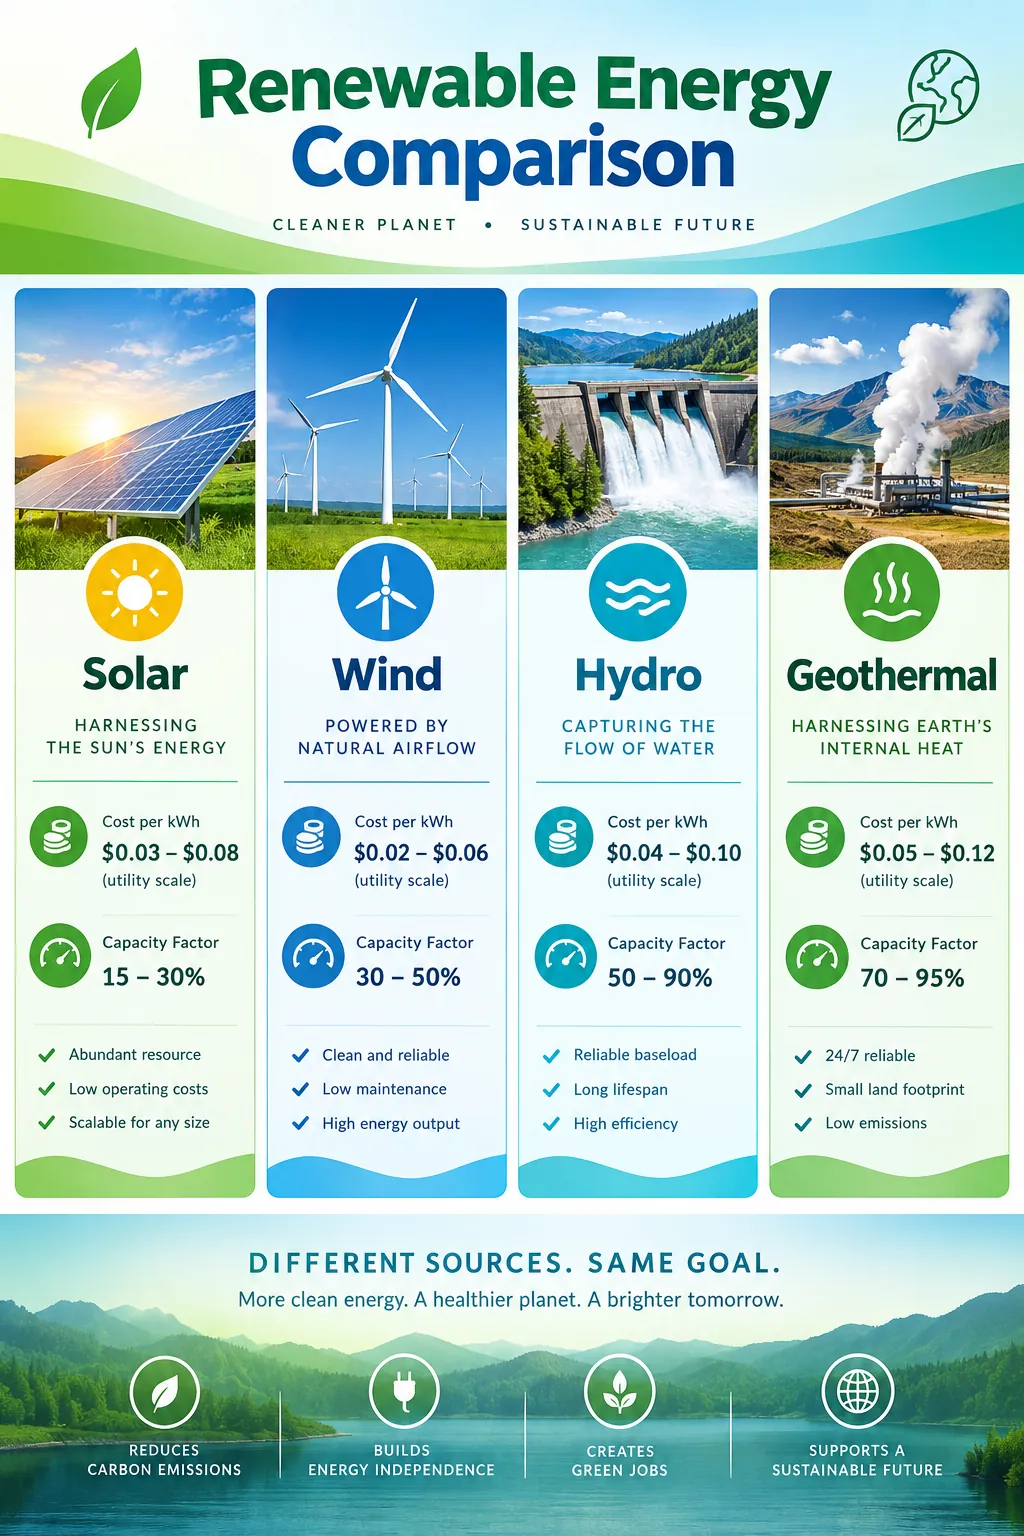
Compare solar, wind, hydro, geothermal, and biomass: levelized cost per kWh, capacity factors, emissions, and 2030 growth projections.
Published
Generate a custom version of this infographic
Customize with your own data, style, and branding
Generate This InfographicKey Comparisons
Comparing Renewable Energy Sources Comparison
Renewable energy sources are transforming the global power grid as costs fall and deployment accelerates across every continent. Solar photovoltaic and onshore wind are now the cheapest sources of new electricity generation in most markets, with levelized costs below $0.05 per kilowatt-hour in optimal conditions. Hydropower remains the largest renewable contributor globally, supplying approximately 16 percent of world electricity, though new project development is limited by geography and environmental concerns
Geothermal provides reliable baseload power with capacity factors exceeding 90 percent but is restricted to tectonically active regions. Corporate power purchase agreements for renewable energy exceeded 50 gigawatts globally in 2024, signaling strong private-sector demand beyond government mandates. Biomass offers dispatchable renewable energy but raises sustainability questions around land use and emissions from combustion
Global renewable capacity additions reached 510 gigawatts in 2024, with solar accounting for roughly 75 percent of new installations. Energy storage paired with renewables is growing rapidly, with battery costs falling 89 percent since 2010. Offshore wind capacity is projected to grow tenfold by 2030 in leading markets including Europe and Asia-Pacific
By 2030, renewables are projected to supply over 42 percent of global electricity, up from 30 percent today, driven by policy mandates and corporate procurement commitments.
Levelized cost is only the first filter when comparing solar, wind, hydro, geothermal, and biomass. Solar PV and onshore wind now undercut new fossil generation in most markets, with Lazar and IRENA analyses citing onshore wind near 0.033 dollars per kilowatt-hour in strong resource zones and solar below 0.05 in sun-rich regions. Those headline numbers assume favorable siting; grid connection fees, curtailment, and interconnection queues can shift project economics more than module or turbine prices alone.
Capacity factor and geography separate intermittent renewables from firm resources. Utility-scale solar and onshore wind typically operate in rough 25 to 35% capacity factor ranges depending on site, while geothermal plants often exceed 90% and hydropower delivers steady output where reservoirs are managed sustainably. Hydropower still supplies about 16% of global electricity, the largest renewable share by generation, but new dam projects face lengthy environmental review and climate-sensitive flow risks that solar and wind avoid.
Storage pairing redefines what solar and wind can displace. BloombergNEF data show battery costs fell about 89% between 2010 and 2024, enabling hybrid plants that compete with gas peakers when renewable capture plus four-hour storage beats fuel volatility. Corporate power purchase agreements surpassed about 50 gigawatts globally in 2024, signaling that private buyers chase additionality and stable pricing beyond compliance mandates. Offshore wind scaling toward tenfold growth by 2030 in Europe and Asia-Pacific adds higher-capacity-factor wind where land constraints bind onshore development.
Sustainability trade-offs differ by technology rather than ranking renewables as uniformly impact-free. Solar and wind carry the lowest lifecycle greenhouse gas intensity, while biomass combustion raises questions about feedstock sourcing and land use, and large hydropower can disrupt fisheries and methane from reservoirs if poorly sited. Policy targets such as renewables supplying more than 42% of global electricity by 2030, up from about 30% today in IEA outlooks, depend on permitting reform and transmission investment as much as on raw gigawatt additions.
Developers and grid planners increasingly model portfolios instead of single-technology winners. A balanced mix might pair cheap solar midday output with wind diversity across seasons, hydro or geothermal anchoring nights, and batteries covering ramp hours. Understanding each source’s cost band, capacity profile, and local constraint set beats declaring one universal champion for every region.
Permitting, transmission, and supply chains often decide timelines more than technology cost does. Interconnection queues, local opposition, and equipment lead times can delay projects that look attractive on paper, while policy support for grids and storage determines how much cheap generation actually reaches customers. Comparing sources on cost alone therefore understates real-world deployment risk.
Frequently Asked Questions
Which renewable energy source is the most cost-effective?
Can renewable energy provide reliable baseload power?
How do renewable energy sources compare on environmental impact?
What role does energy storage play in the renewable transition?
Sources
- International Renewable Energy Agency (IRENA), 2024
- International Energy Agency (IEA) World Energy Outlook, 2024
- BloombergNEF Energy Storage Market Outlook, 2024
- Lazard Levelized Cost of Energy Analysis, 2024
Source links go to each publisher's official website.
Embed This Infographic
Copy the code below to share this infographic on your website
<a href="https://www.makeinfographics.ai/infographic/renewable-energy-comparison" target="_blank" rel="noopener">
  <img src="https://pic-cdn.chibistyle.app/infographics/infographics/renewable-energy.webp"
       alt="Renewable Energy Sources Comparison — Compare solar, wind, hydro, geothermal, and biomass: levelized cost per kWh, capacity factors, emiss"
       width="960" height="1440" loading="lazy"
       style="max-width:100%;height:auto;" />
</a>
<p>Source: <a href="https://www.makeinfographics.ai">MakeInfographics.ai</a> — Free AI Infographic Generator</p>
Create Your Own Renewable Energy Sources Comparison Infographic
Customize this topic with your own data, style, and branding
Create Custom Version — FreeMake Something for Your Own Life
Free printable planners, blank or filled in by AI from your details.


Related Infographics
All Sustainability & ESG infographics →Fast Fashion vs Sustainable Fashion 2026
Fashion emits 8–10% of global CO2 and 92M tons of textile waste yearly. Compare fast vs sustainable models on water, labor, waste, and resale.
Microplastics: The Invisible Pollution Crisis 2026
Microplastics in oceans, soil, and blood: 14.4M tons on the seabed, ~5 g ingested weekly, tire wear at 28%, and 80+ nations curbing plastics.
Climate Change Statistics
Key climate data visualized: 1.2°C warming since pre-industrial times, record CO2 levels, ice sheet loss, and accelerating renewable energy adoption.
E-Waste Recycling Process & Global Statistics 2026
Global e-waste hit 62 million tonnes in 2022; only 22.3% was formally recycled—how collection, dismantling, shredding, separation, and recovery work.