

E-Waste Recycling Process & Global Statistics 2026 Infographic
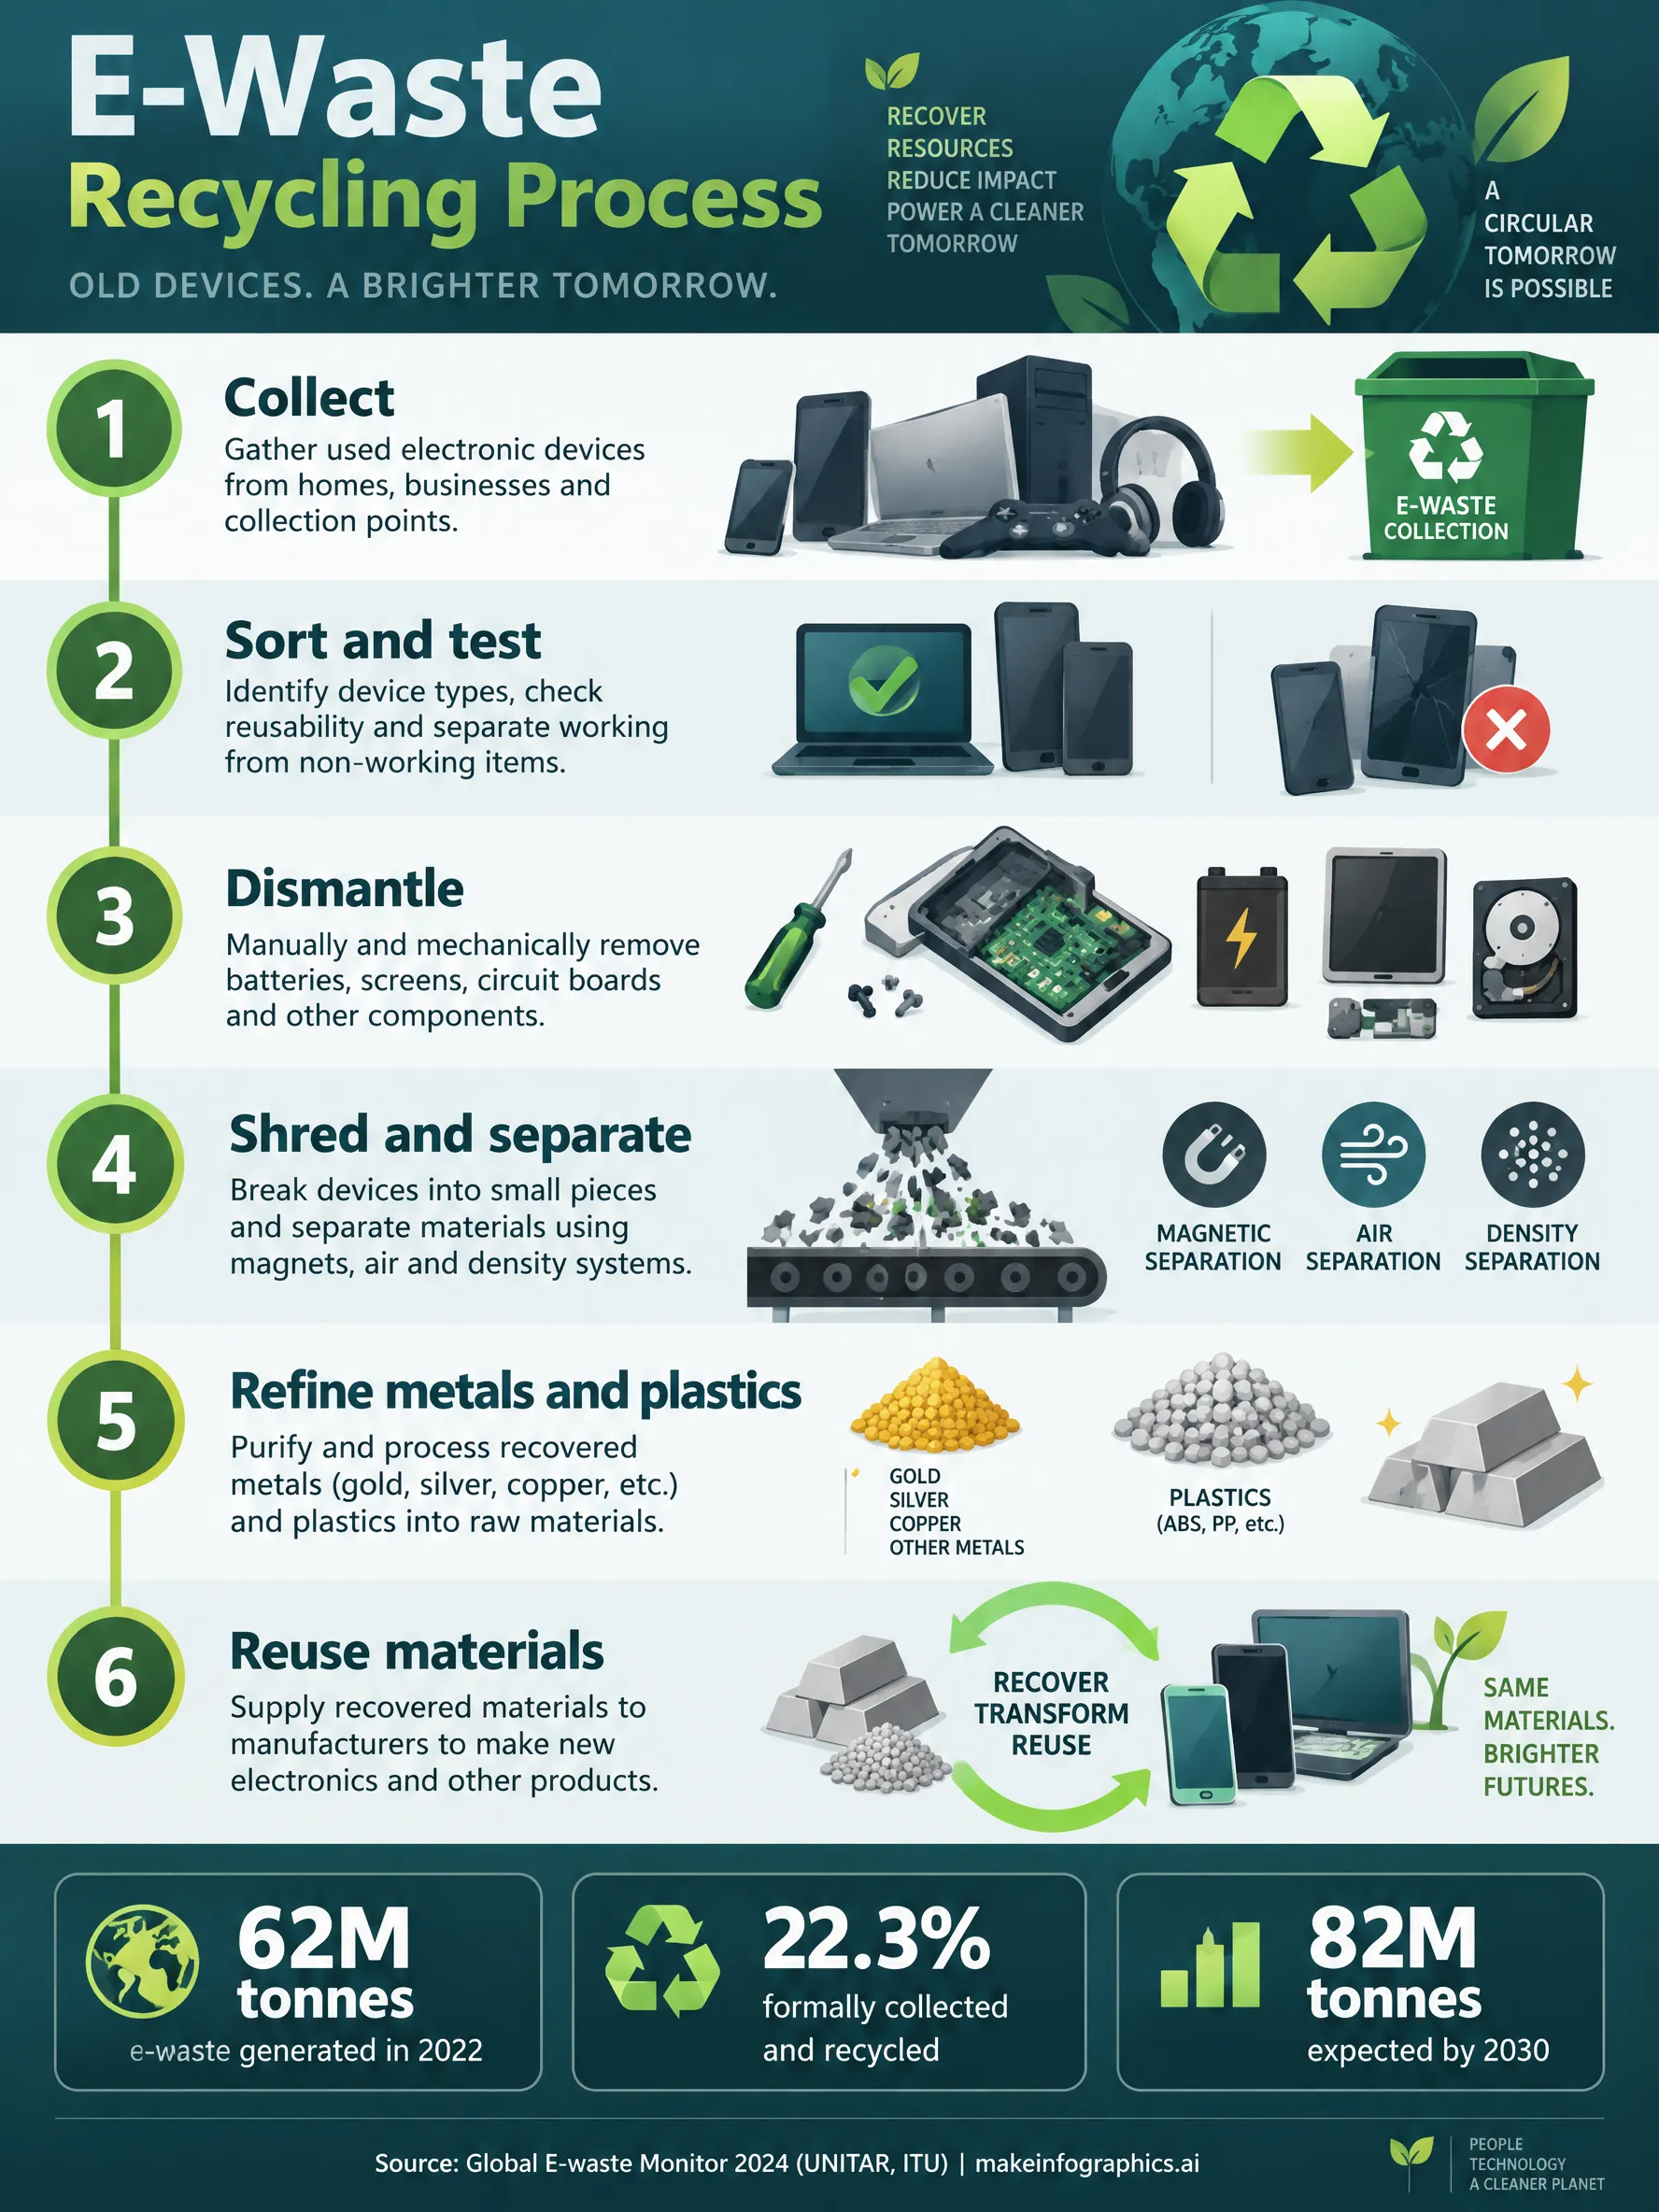
Global e-waste hit 62 million tonnes in 2022; only 22.3% was formally recycled—how collection, dismantling, shredding, separation, and recovery work.
Published
Generate a custom version of this infographic
Customize with your own data, style, and branding
Generate This InfographicProcess Steps
How E-Waste Recycling Process & Global Statistics 2026
Electronic waste is any discarded product with a plug or battery, from refrigerators and laptops to toys and vape devices. The fourth Global E-waste Monitor, published in March 2024 by the International Telecommunication Union and the United Nations Institute for Training and Research, remains the newest global edition as of 2026; the next triennial Monitor is planned for 2027. That report anchors both the scale of the problem and the vocabulary regulators use when they talk about "formally collected and recycled in an environmentally sound manner," which is stricter than simply dropping a phone in a bin.
The management chain starts when a device leaves the owner. Collectors gather material through municipal drop-off, retailers, producer take-back schemes, and repair shops. The Monitor tracks four main routes after collection, but the physical process is easier to picture as a funnel. Reusable units are tested, repaired, or refurbished and re-enter the market. Everything else moves into pre-treatment: depollution removes batteries, mercury lamps, refrigerants, and other hazardous fractions before they contaminate downstream material. Manual dismantling separates high-value components such as printed circuit boards, hard drives, and wiring harnesses. What cannot be economically disassembled by hand is shredded, then sorted with magnets, eddy currents, air tables, and optical sorters to pull out ferrous and non-ferrous metals, plastics, and glass. Final treatment sends clean metal streams to smelters and refiners, plastics to specialized recyclers, and glass from old screens into controlled recovery loops, while residues that cannot be safely recovered go to engineered disposal.
The U.S. Environmental Protection Agency describes the same idea in plain language: recycling means sorting, dismantling, mechanically separating, and recovering valuable materials such as gold, copper, glass, and aluminum so they can feed manufacturing again. Facilities differ—some emphasize resale and demanufacturing, others specialize in shredding and separation—but the sequence in the infographic reflects what compliant plants aim for, not what happens when whole devices are mixed with scrap or processed in open-air informal yards.
Global statistics explain why the funnel matters. In 2022 the world generated a record 62 million tonnes of e-waste, about 7.8 kilograms for every person on Earth, up from 34 million tonnes in 2010. Only 22.3 percent of that mass—roughly 13.8 million tonnes—was documented as formally collected and recycled. Generation is projected to reach 82 million tonnes by 2030 if current trends hold, while documented recycling is not keeping pace; the Monitor estimates that e-waste generation since 2010 has grown about five times faster than compliant collection and recycling. Category matters: small equipment such as toys and vacuum cleaners makes up a large share of the stream but sees very low formal recycling, while bulky categories are handled more often. Europe generates the most e-waste per capita and achieves the highest documented collection rate among regions; Africa reports the lowest documented share.
Policy shapes what "good" looks like. The European Union WEEE Directive requires member states to collect at least 65 percent of the average weight of electrical equipment placed on the market over the prior three years, or alternatively 85 percent of WEEE generated domestically, from 2019 onward. That legal floor sits far above the global formal rate, yet Eurostat still measured EU-wide collection at 37.5 percent in 2023 using the placed-on-market method—evidence that targets, infrastructure, and consumer behavior do not move in lockstep. Once WEEE is separately collected, the directive sets category-specific recovery and recycling minima for material sent to treatment, such as 85 percent recovery and 80 percent preparation for reuse and recycling for large appliances and temperature-exchange equipment.
For households and IT teams, the practical lesson is to keep hazardous fractions intact, use certified recyclers that document destruction, and favor repair or resale before shredding. Export of broken equipment to unknown processors undercuts global averages and exposes workers to informal burning and acid leaching. Governments, meanwhile, need harmonized measurement (the Monitor aligns with SDG indicator 12.5.1), enforcement of extended producer responsibility, and design rules that make dismantling faster. The process diagram paired with this entry is meant to show where value is captured—and where it is lost when collection skips straight to mixed shredding or landfill.
Frequently Asked Questions
What counts as e-waste?
What happens after e-waste is collected?
How much e-waste is recycled worldwide?
Is there a newer Global E-waste Monitor than the 2024 edition?
How do EU WEEE collection rules compare with global recycling rates?
Sources
- International Telecommunication Union, Global E-waste Monitor 2024, 2024
- United Nations Institute for Training and Research, Global E-waste Monitor 2024, 2024
- U.S. Environmental Protection Agency, Electronics Basic Information, 2025
- European Union, Directive 2012/19/EU on WEEE, 2012
- Eurostat, Waste Statistics - Electrical and Electronic Equipment, 2025
Source links go to each publisher's official website.
Embed This Infographic
Copy the code below to share this infographic on your website
<a href="https://www.makeinfographics.ai/infographic/e-waste-recycling-process-global-statistics-2026" target="_blank" rel="noopener">
  <img src="https://pic-cdn.chibistyle.app/infographics/infographics/e-waste-recycling-process-2026.webp"
       alt="E-Waste Recycling Process & Global Statistics 2026 — Global e-waste hit 62 million tonnes in 2022; only 22.3% was formally recycled—how collection, disma"
       width="960" height="1280" loading="lazy"
       style="max-width:100%;height:auto;" />
</a>
<p>Source: <a href="https://www.makeinfographics.ai">MakeInfographics.ai</a> — Free AI Infographic Generator</p>
Create Your Own E-Waste Recycling Process & Global Statistics 2026 Infographic
Customize this topic with your own data, style, and branding
Create Custom Version — FreeRelated Infographics
All Sustainability & ESG infographics →Circular Economy & Zero Waste Statistics 2026
2.3B tonnes of waste yearly, 17% global recycling, 9% plastic recycled, $600B circular economy market—2026 zero-waste data.
Electric Vehicle Charging Infrastructure 2026
4.5M public EV chargers worldwide in 2026: grid planning, permitting delays, NACS adoption, utilization economics, and the path to 15M points by 2030.
Fast Fashion vs Sustainable Fashion 2026
Fashion emits 8–10% of global CO2 and 92M tons of textile waste yearly. Compare fast vs sustainable models on water, labor, waste, and resale.
Ocean Pollution & Conservation Statistics
About 14M metric tons of plastic enter oceans yearly; dead zones, acidification, and MPAs at 8.3% coverage define 2026 marine data.