

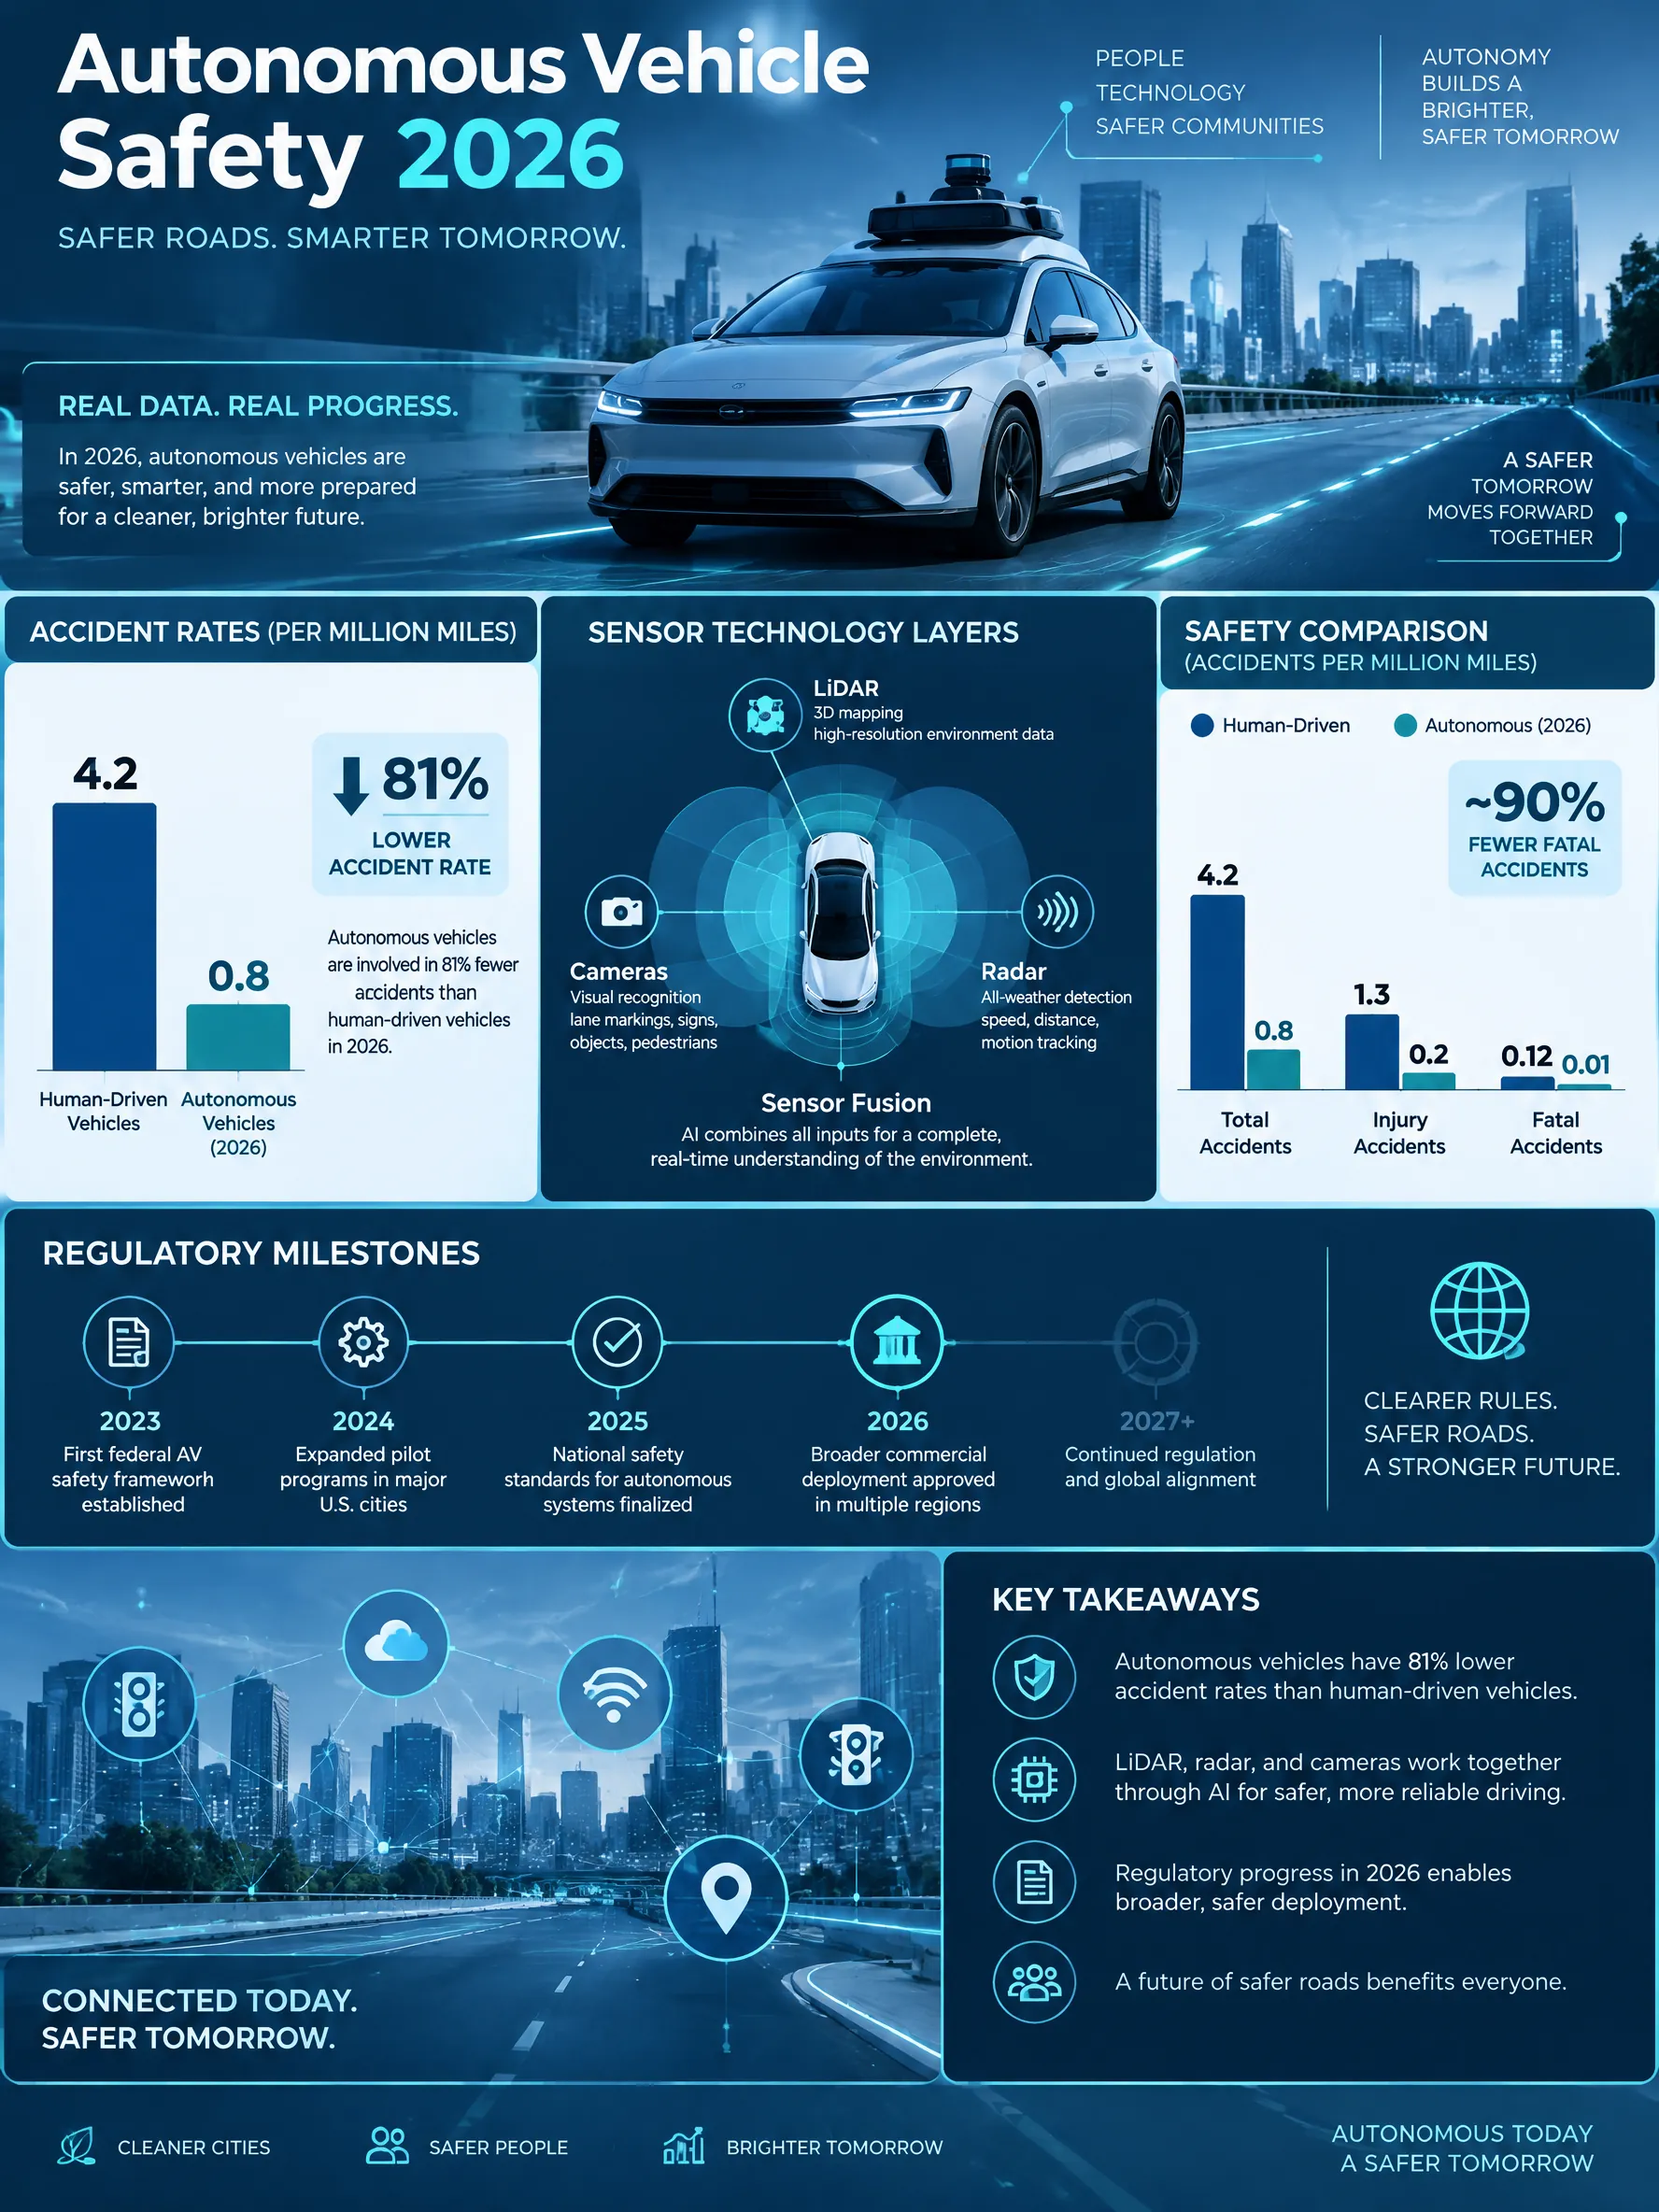
Autonomous Vehicle Safety Statistics 2026 Infographic
Self-driving car safety data, accident rates vs human drivers, sensor technology layers, regulatory milestones, and AV deployment statistics worldwide.
Published
Generate a custom version of this infographic
Customize with your own data, style, and branding
Generate This InfographicProcess Steps
How Autonomous Vehicle Safety Statistics 2026
Autonomous vehicles have transitioned from research curiosities to commercially deployed transportation systems operating in dozens of cities worldwide. In 2026, the global autonomous vehicle market reached $62 billion, with over 4,500 robotaxis operating in revenue service across the United States, China, and parts of Europe. The technology stack powering these vehicles involves a multi-layered sensing and decision-making process that continues to improve with each mile driven.
The AV safety pipeline follows a rigorous process from perception to action. Step one is environmental sensing: each vehicle combines LiDAR (detecting objects at 200+ meters with centimeter precision), radar (operating reliably in rain, fog, and darkness), cameras (providing color and texture information for sign reading and lane detection), and ultrasonic sensors (handling close-range parking scenarios). Step two is sensor fusion, where onboard computers merge data from all sensors into a unified 3D model of the surroundings, updated 20-30 times per second. Step three is prediction: AI models forecast the likely behavior of every detected object — pedestrians, cyclists, other vehicles — over the next 5-8 seconds. Step four is path planning, where the system calculates optimal routes and maneuvers considering safety margins, traffic rules, and passenger comfort. Step five is actuation, translating decisions into precise steering, acceleration, and braking commands.
Safety data increasingly favors autonomous systems over human drivers. Waymo's fleet logged over 25 million autonomous miles by mid-2026, reporting 73% fewer injury-causing crashes than human drivers in comparable conditions. Cruise data from San Francisco operations showed 48% fewer collisions per million miles than the city average. The National Highway Traffic Safety Administration (NHTSA) estimates that human error causes 94% of all traffic accidents, with distracted driving, impaired driving, and speeding as the top three factors — none of which affect autonomous systems. However, AVs face unique challenges: edge cases involving unusual road configurations, unpredictable pedestrian behavior, and sensor degradation in extreme weather remain areas of active development.
Regulatory frameworks are evolving rapidly. California, Arizona, and Texas have established commercial AV operating permits. The EU's updated General Safety Regulation includes provisions for Level 4 autonomous driving on motorways. China's Ministry of Industry and Information Technology approved commercial robotaxi operations in Beijing, Shanghai, Shenzhen, and Wuhan, with Baidu's Apollo Go completing over 6 million rides. The UN's WP.29 working group is developing international technical standards for AV safety certification. Insurance frameworks are adapting too: by 2026, AV-specific insurance products emerged from major carriers, with premiums based on the vehicle's technology level, operating domain, and manufacturer safety record rather than individual driver history.
The economic impact extends beyond safety. AVs are projected to reduce traffic fatalities by 90% once fully deployed, potentially saving 38,000 lives annually in the US alone. Traffic congestion could decrease 15-30% through optimized routing and platooning. The total addressable market for autonomous mobility services is forecast to reach $2.1 trillion by 2035, encompassing robotaxis, autonomous trucks, delivery robots, and shuttle services.
Frequently Asked Questions
Are autonomous vehicles safer than human drivers?
How do self-driving cars detect their surroundings?
Where can I ride in a self-driving car today?
What are the main challenges for autonomous vehicle adoption?
Sources
- Waymo, Safety Report and Public Road Data, 2026
- National Highway Traffic Safety Administration (NHTSA), Traffic Safety Facts, 2025
- McKinsey & Company, Autonomous Driving Market Forecast, 2026
- Baidu Apollo, Annual Operations Report, 2026
- RAND Corporation, Autonomous Vehicle Safety Framework, 2025
Source links go to each publisher's official website.
Embed This Infographic
Copy the code below to share this infographic on your website
<a href="https://www.makeinfographics.ai/infographic/autonomous-vehicle-safety-statistics-2026" target="_blank" rel="noopener">
  <img src="https://www.makeinfographics.ai/images/infographics/autonomous-vehicle-safety.webp"
       alt="Autonomous Vehicle Safety Statistics 2026 — Self-driving car safety data, accident rates vs human drivers, sensor technology layers, regulatory "
       width="960" height="1280" loading="lazy"
       style="max-width:100%;height:auto;" />
</a>
<p>Source: <a href="https://www.makeinfographics.ai">MakeInfographics.ai</a> — Free AI Infographic Generator</p>
Create Your Own Autonomous Vehicle Safety Statistics 2026 Infographic
Customize this topic with your own data, style, and branding
Create Custom Version — FreeRelated Infographics
All Technology & SaaS infographics →Artificial Intelligence Trends 2026
Explore 2026 AI trends: generative AI adoption, enterprise spending above $300B, agentic systems, and industry use cases from healthcare to finance.
Remote Work Productivity Statistics
Remote work data: 58% of knowledge workers hybrid, measurable productivity gains, $11K annual savings per remote employee, and rising satisfaction scores.
Blockchain Technology Explained
How blockchain works: distributed ledgers, consensus mechanisms, smart contracts, DeFi growth, and enterprise adoption across supply chain and finance.
Cybersecurity Best Practices
Essential cybersecurity practices: password hygiene, MFA adoption, phishing defense, encryption standards, and incident response for organizations.