

Marketing Attribution Models Explained: Guide 2026 Infographic
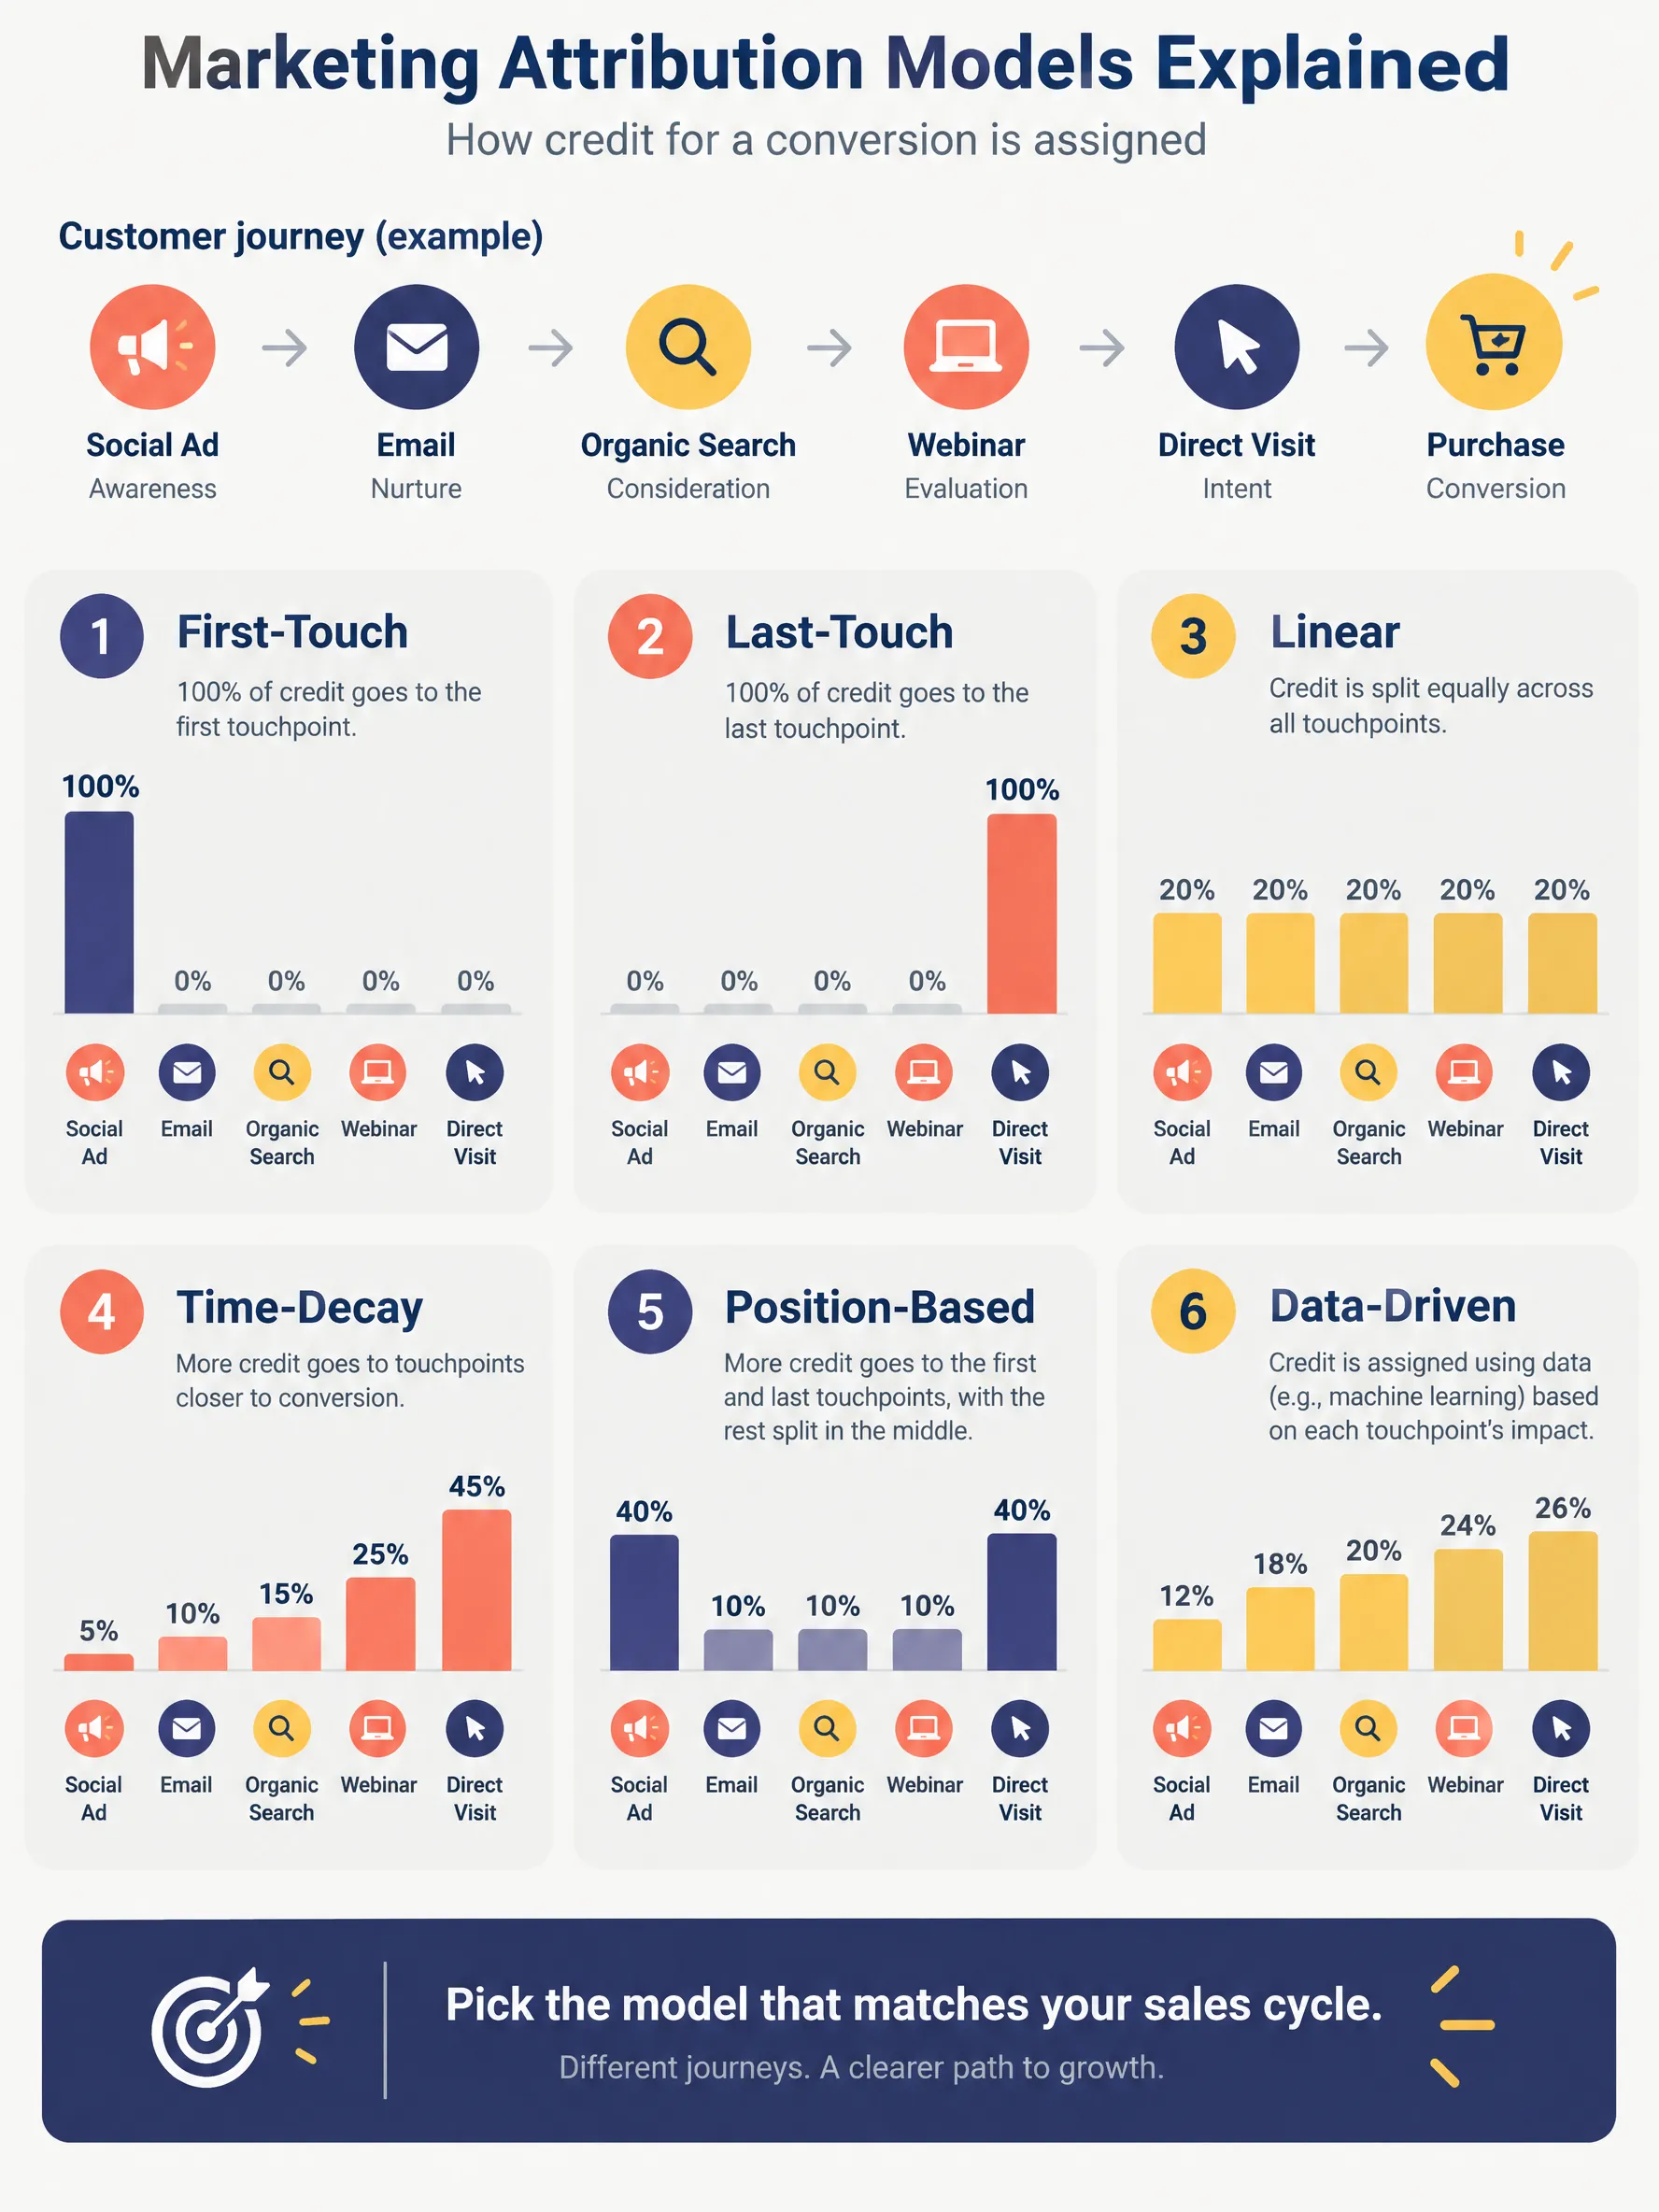
Marketing attribution models compared: first-touch, last-touch, linear, time-decay, position-based, and data-driven, with tips on choosing one.
Published
Generate a custom version of this infographic
Customize with your own data, style, and branding
Generate This InfographicKey Insights
- 1Marketing budgets averaged 7.7% of company revenue in 2024 and 2025, down from 9.1% in 2023 (Gartner, CMO Spend Survey, 2025)
- 2The median B2B buying group involves 6 to 10 decision makers (Gartner, B2B buying research, 2020)
- 3B2B buyers spend about 17% of their purchase-journey time meeting with potential suppliers (Gartner, Digital B2B Buyer Survey, 2017)
- 4Paid and organic data-driven attribution is the default reporting model in Google Analytics 4 (Google Analytics Help Center, 2025)
- 5GA4 retired first-click, linear, time-decay, and position-based reporting models in November 2023 (Google Analytics Help Center, 2025)
Guide to Marketing Attribution Models Explained: Guide 2026
Attribution answers a deceptively simple question: which marketing touchpoints deserve credit when a customer converts? Because modern buying journeys cross paid social, email, organic search, webinars, and direct visits, the model you choose changes which channels look profitable and therefore where the next budget dollar goes. Gartner's CMO Spend Survey found marketing budgets averaging 7.7 percent of company revenue in both 2024 and 2025, down from 9.1 percent in 2023, so teams have less room to keep funding channels that merely look good in a report.
Single-touch models are the simplest. First-touch gives 100 percent of the credit to the first recorded interaction, which favors awareness channels such as content, paid social, and organic search. Last-touch gives it all to the final click, which favors bottom-funnel channels such as branded search, retargeting, and email. Both are easy to explain and implement, but each ignores everything on the other side of the journey. A team that reads only last-touch reports tends to cut the awareness spend that fills the funnel, then wonders why branded search declines a quarter later.
Rule-based multi-touch models spread credit across the path. Linear splits it equally among all touchpoints. Time-decay gives more weight to touches closer to the conversion. Position-based, often called U-shaped, commonly assigns 40 percent to the first touch, 40 percent to the last, and divides the remaining 20 percent across the middle. These models do a better job of showing the supporting cast of a conversion, yet the weights are assumptions rather than measurements. Platform support also changes: Google Analytics 4 retired its first-click, linear, time-decay, and position-based reporting models in November 2023, leaving data-driven attribution as the default alongside last-click options. If you rely on rule-based models, you may need a separate analytics layer or a warehouse query to keep using them.
Data-driven attribution uses machine learning to compare converting and non-converting paths and estimate how much each touchpoint changed the odds of conversion. It adapts to your own data instead of assuming fixed weights, which makes it the most defensible choice for accounts with enough conversion volume. The tradeoffs are transparency and coverage. The model is harder to explain to a finance team, it needs a minimum number of conversions to be stable, and it can only credit touchpoints that were actually tracked. Cross-device journeys, offline conversations, and consent-limited traffic stay partly invisible no matter which model you choose.
B2B marketing adds another wrinkle. Gartner research describes a typical buying group of 6 to 10 decision makers, and finds that buyers spend only about 17 percent of their total purchase-journey time meeting with potential suppliers; the rest goes to independent research and internal discussion. A model that tracks one contact's last click will miss most of that account-level activity. This is why B2B teams often pair contact-level multi-touch reports with account-level engagement scoring and with feedback from sales about which conversations actually moved a deal forward.
How to choose in practice: for short sales cycles with few channels, last-touch plus a first-touch sanity check is usually adequate. For longer cycles with four or more active channels, start with linear or position-based as a baseline and move to data-driven attribution when volume allows. Whatever you pick, document it, apply it consistently, and compare at least two models side by side before reallocating budget. When two models disagree sharply about a channel, treat that as a prompt to run an incrementality test, such as a geographic holdout or a short spend pause, instead of trusting either number blindly.
A few hygiene steps make every model more reliable. Standardize UTM naming so that channels are not split across spellings. Define conversion events that match revenue, not just form fills. Align lookback windows with your real sales cycle rather than platform defaults. Import offline conversions from your CRM so closed deals are not missing from the data. Finally, review attribution monthly and present results as a one-page visual that shows the same conversions under different models, because the gap between models is often the most useful insight for planning the next quarter's budget.
Frequently Asked Questions
What is the best marketing attribution model?
What is the difference between first-touch and last-touch attribution?
Does Google Analytics 4 still support linear and position-based attribution?
How many conversions do I need for data-driven attribution?
How should B2B teams approach attribution?
Sources
Source links go to each publisher's official website.
Embed This Infographic
Copy the code below to share this infographic on your website
<a href="https://www.makeinfographics.ai/infographic/marketing-attribution-models-guide-2026" target="_blank" rel="noopener">
  <img src="https://pic-cdn.chibistyle.app/infographics/infographics/marketing-attribution-models-2026.webp"
       alt="Marketing Attribution Models Explained: Guide 2026 — Marketing attribution models compared: first-touch, last-touch, linear, time-decay, position-based, "
       width="960" height="1280" loading="lazy"
       style="max-width:100%;height:auto;" />
</a>
<p>Source: <a href="https://www.makeinfographics.ai">MakeInfographics.ai</a> — Free AI Infographic Generator</p>
Create Your Own Marketing Attribution Models Explained: Guide 2026 Infographic
Customize this topic with your own data, style, and branding
Create Custom Version — FreeRelated Infographics
All Marketing infographics →Social Media Marketing Strategy
Social media marketing guide: platform demographics, optimal posting times, content performance benchmarks, and ROI data for brands in 2026.
Account-Based Marketing Statistics 2026
ABM strategy process, ROI benchmarks, adoption rates, technology stack, and performance comparison versus traditional demand generation approaches.
Short-Form Video Marketing ROI & Statistics 2026
Short-form video data: 2.5B daily TikTok users, Reels engagement rates, video ad spend growth, creator economy metrics, and ROI benchmarks by platform.
Podcast Advertising Growth Statistics 2026
Podcast ad market data: $4.5B revenue, listener demographics, ad format comparison, genre performance, and brand lift benchmarks for audio marketing.