

Social Media Marketing Strategy Infographic
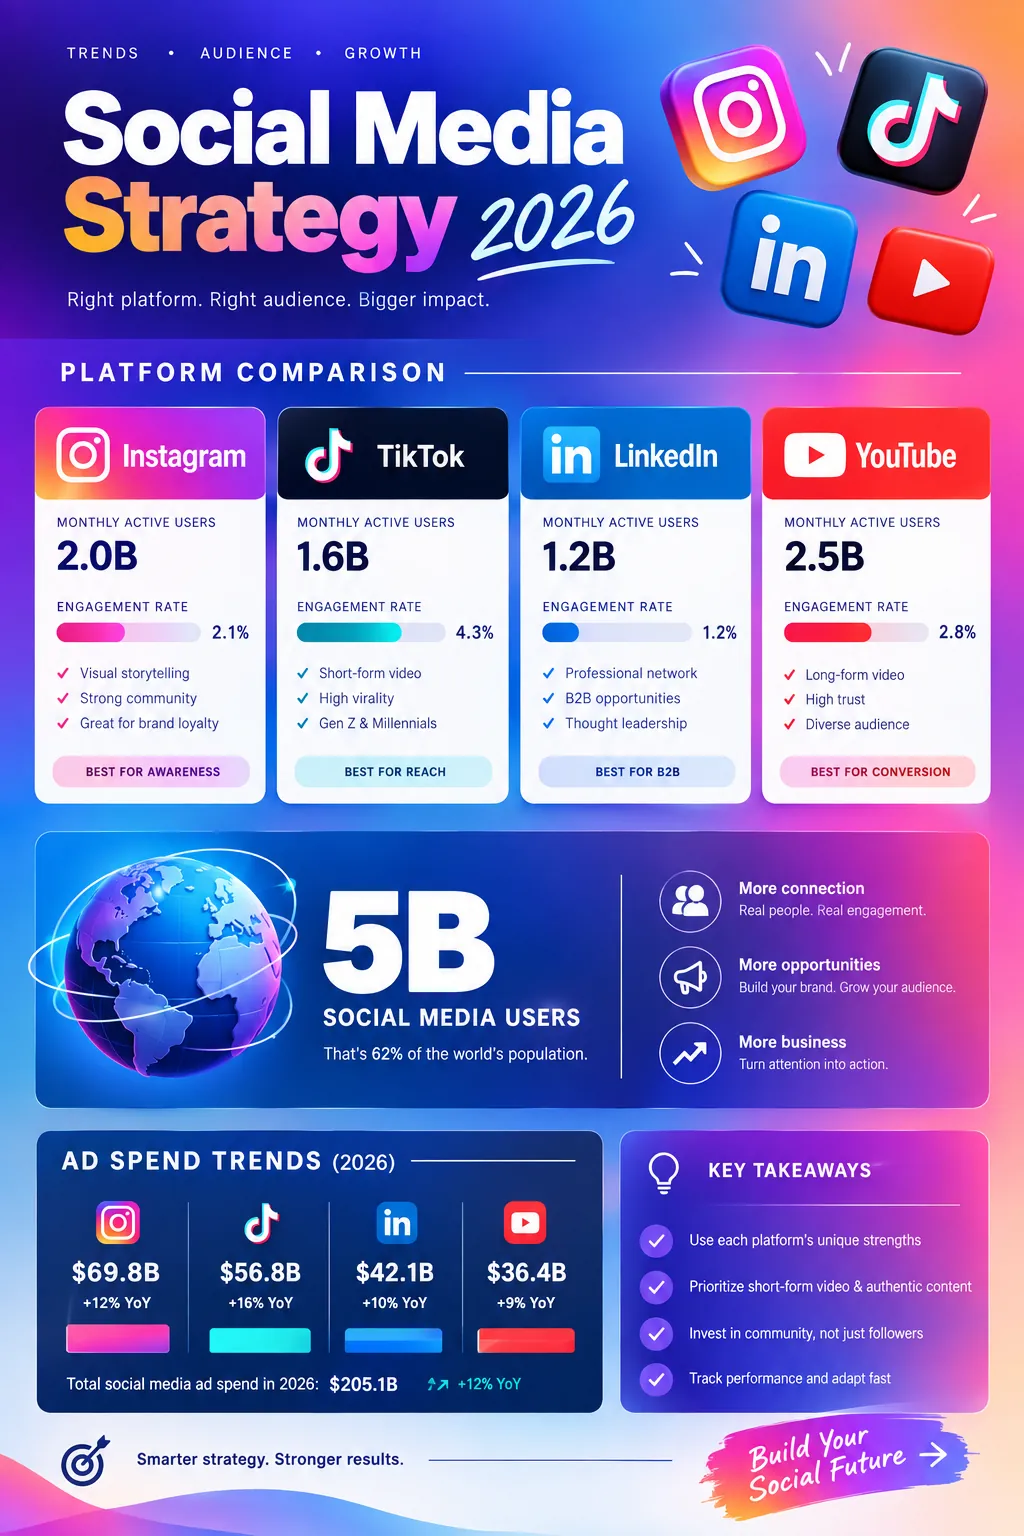
Social media marketing guide: platform demographics, optimal posting times, content performance benchmarks, and ROI data for brands in 2026.
Published · Updated
Generate a custom version of this infographic
Customize with your own data, style, and branding
Generate This InfographicKey Insights
- 1Over 5 billion people use social media globally, 62%+ of world population (DataReportal, 2025)
- 2Short-form video generates 2.5x more engagement than static image posts (HubSpot, 2025)
- 3LinkedIn drives 80% of B2B social media leads for professional services (LinkedIn Marketing Solutions)
- 4Global social media ad spend exceeded $230 billion in 2025 (Statista)
- 5Average ROAS for e-commerce retargeting campaigns ranges from 3:1 to 5:1 (Meta Business, 2025)
- 6User-generated content achieves 4x higher click-through rates than brand ads (Stackla Consumer Content Report)
- 7Instagram Reels reach 50% more non-followers than feed posts for business accounts (Instagram Business)
Guide to Social Media Marketing Strategy
Social media marketing remains one of the highest-ROI channels for brand awareness, customer engagement, and direct sales in 2026. Over 5 billion people worldwide use social platforms, representing more than 62 percent of the global population. Instagram and TikTok dominate among audiences aged 18 to 34, while LinkedIn drives 80 percent of B2B social media leads
Short-form video content generates 2.5 times more engagement than static images across major platforms, making Reels, TikTok, and YouTube Shorts essential formats for reach. Social commerce features now enable direct in-app purchases on Instagram, TikTok Shop, and Pinterest, shortening the path from discovery to conversion. Optimal posting frequency varies by platform: brands posting 3 to 5 times weekly on Instagram see the strongest follower growth, while LinkedIn rewards consistent weekday publishing
Paid social advertising spend exceeded $230 billion globally in 2025, with average return on ad spend ranging from 3:1 to 5:1 for e-commerce brands using retargeting campaigns. User-generated content and influencer partnerships deliver 4 times higher click-through rates than brand-created ads alone. Algorithm changes on major platforms increasingly reward authentic engagement over follower count alone
Micro-influencer partnerships deliver higher engagement rates at lower cost than celebrity endorsements. A data-driven strategy combining organic content, paid amplification, and community management consistently outperforms single-channel approaches.
Platform economics in 2026 still reward format fit over uniform posting calendars. DataReportal-scale reach above 5 billion users means audience saturation; the battle is attention quality. Short-form video at roughly 2.5 times the engagement of static images pushes brands to repurpose hero messages into vertical hooks, while LinkedIn continues to supply about 80 percent of B2B social leads for professional services where thought leadership and case proof outperform viral stunts.
Paid and organic loops increasingly share measurement stacks. Statista-tracked global social ad spend above $230 billion in 2025 pairs with Meta-reported retargeting return on ad spend often between 3:1 and 5:1 for e-commerce, but only when product feeds, creative rotation, and exclusion lists stay disciplined. Stackla-style findings that user-generated content can achieve about four times the click-through of brand-only ads explain why community sourcing and micro-influencer contracts sit beside studio production budgets.
Algorithm shifts on Instagram, TikTok, and YouTube prioritize retention, saves, and meaningful comments over raw follower counts. Instagram Business notes that Reels can reach about 50 percent more non-followers than feed posts for business accounts, which changes how teams allocate production time. TikTok Shop and in-app checkout on Meta and Pinterest compress discovery-to-purchase paths, so social teams must coordinate with merchandising and customer support, not treat platforms as billboards alone.
Operational best practice for 2027 planning combines three rhythms: consistent weekday LinkedIn publishing for B2B credibility, three to five weekly Instagram posts plus Stories for lifestyle brands, and daily short-form tests on TikTok where creative fatigue arrives fastest. UTM tagging, platform-native analytics, and cohort reviews of assisted conversions prevent vanity metrics from masking stagnant revenue contribution.
Community management completes the loop organic posts start. Response time, escalation paths for product complaints, and moderation standards affect both algorithmic distribution and brand trust. Employee advocacy programs multiply reach at lower cost than celebrity tiers, aligning with micro-influencer engagement advantages. Training internal subject-matter experts to post natively often outperforms polished corporate accounts on LinkedIn and X for technical categories.
Budget allocation in 2026 typically splits among creative production, paid amplification, tooling, and influencer fees. Teams that underfund testing iterate too slowly on short-form hooks, while teams that over-index on paid without organic proof points pay higher CPMs for cold audiences. Quarterly creative audits against competitor share of voice and sentiment trends keep strategies adaptive as platforms roll out new ad formats and attribution windows.
Measurement discipline separates teams that grow from teams that merely post. Reach and impressions help diagnose creative, but budget decisions should rest on assisted conversions, cost per qualified lead, and revenue contribution. Because social touches often happen early in the buying journey, last-touch reports tend to understate their value. Comparing first-touch, last-touch, and position-based views of the same conversions shows how much demand social creates versus how much it closes, and a simple holdout test, such as pausing a campaign in one region for two weeks, tells you whether a channel is truly incremental before you cut or double its budget.
Common mistakes are predictable: reposting one asset unchanged across every platform, chasing follower counts instead of saves and replies, ignoring comments for days, and rewriting the strategy every week without a testing window. A sustainable cadence is a quarterly cycle. Set one goal per platform, test three hook formats per month, review results on a fixed date, retire the weakest formats, and document what worked so new team members do not repeat old experiments.
Frequently Asked Questions
Which social media platform is best for marketing in 2026?
How often should brands post on social media?
What type of content performs best on social media?
How long should I test a new social content format?
How do you measure social media marketing ROI?
Sources
- DataReportal Digital 2025 Global Overview
- HubSpot State of Marketing Report, 2025
- Statista Social Media Advertising Outlook, 2025
- LinkedIn Marketing Solutions, 2024
Source links go to each publisher's official website.
Embed This Infographic
Copy the code below to share this infographic on your website
<a href="https://www.makeinfographics.ai/infographic/social-media-marketing-strategy" target="_blank" rel="noopener">
  <img src="https://pic-cdn.chibistyle.app/infographics/infographics/social-media.webp"
       alt="Social Media Marketing Strategy — Social media marketing guide: platform demographics, optimal posting times, content performance benc"
       width="960" height="1440" loading="lazy"
       style="max-width:100%;height:auto;" />
</a>
<p>Source: <a href="https://www.makeinfographics.ai">MakeInfographics.ai</a> — Free AI Infographic Generator</p>
Create Your Own Social Media Marketing Strategy Infographic
Customize this topic with your own data, style, and branding
Create Custom Version — FreeMake Something for Your Own Life
Free printable planners, blank or filled in by AI from your details.
Related Infographics
All Marketing infographics →Influencer Marketing vs Traditional Advertising 2026
Influencer marketing averages $5.78 ROI per dollar vs $2.80 for display ads; compare trust, conversion, and cost per acquisition in 2026.
Influencer Marketing Industry Statistics 2026
Influencer marketing is a $24B industry in 2026 with ~$5.78 ROI per $1 spent. Benchmark engagement by tier, platform shifts, and fraud controls.
Account-Based Marketing Statistics 2026
ABM strategy process, ROI benchmarks, adoption rates, technology stack, and performance comparison versus traditional demand generation approaches.
Marketing Attribution Models Explained: Guide 2026
Marketing attribution models compared: first-touch, last-touch, linear, time-decay, position-based, and data-driven, with tips on choosing one.