

Account-Based Marketing Statistics 2026 Infographic
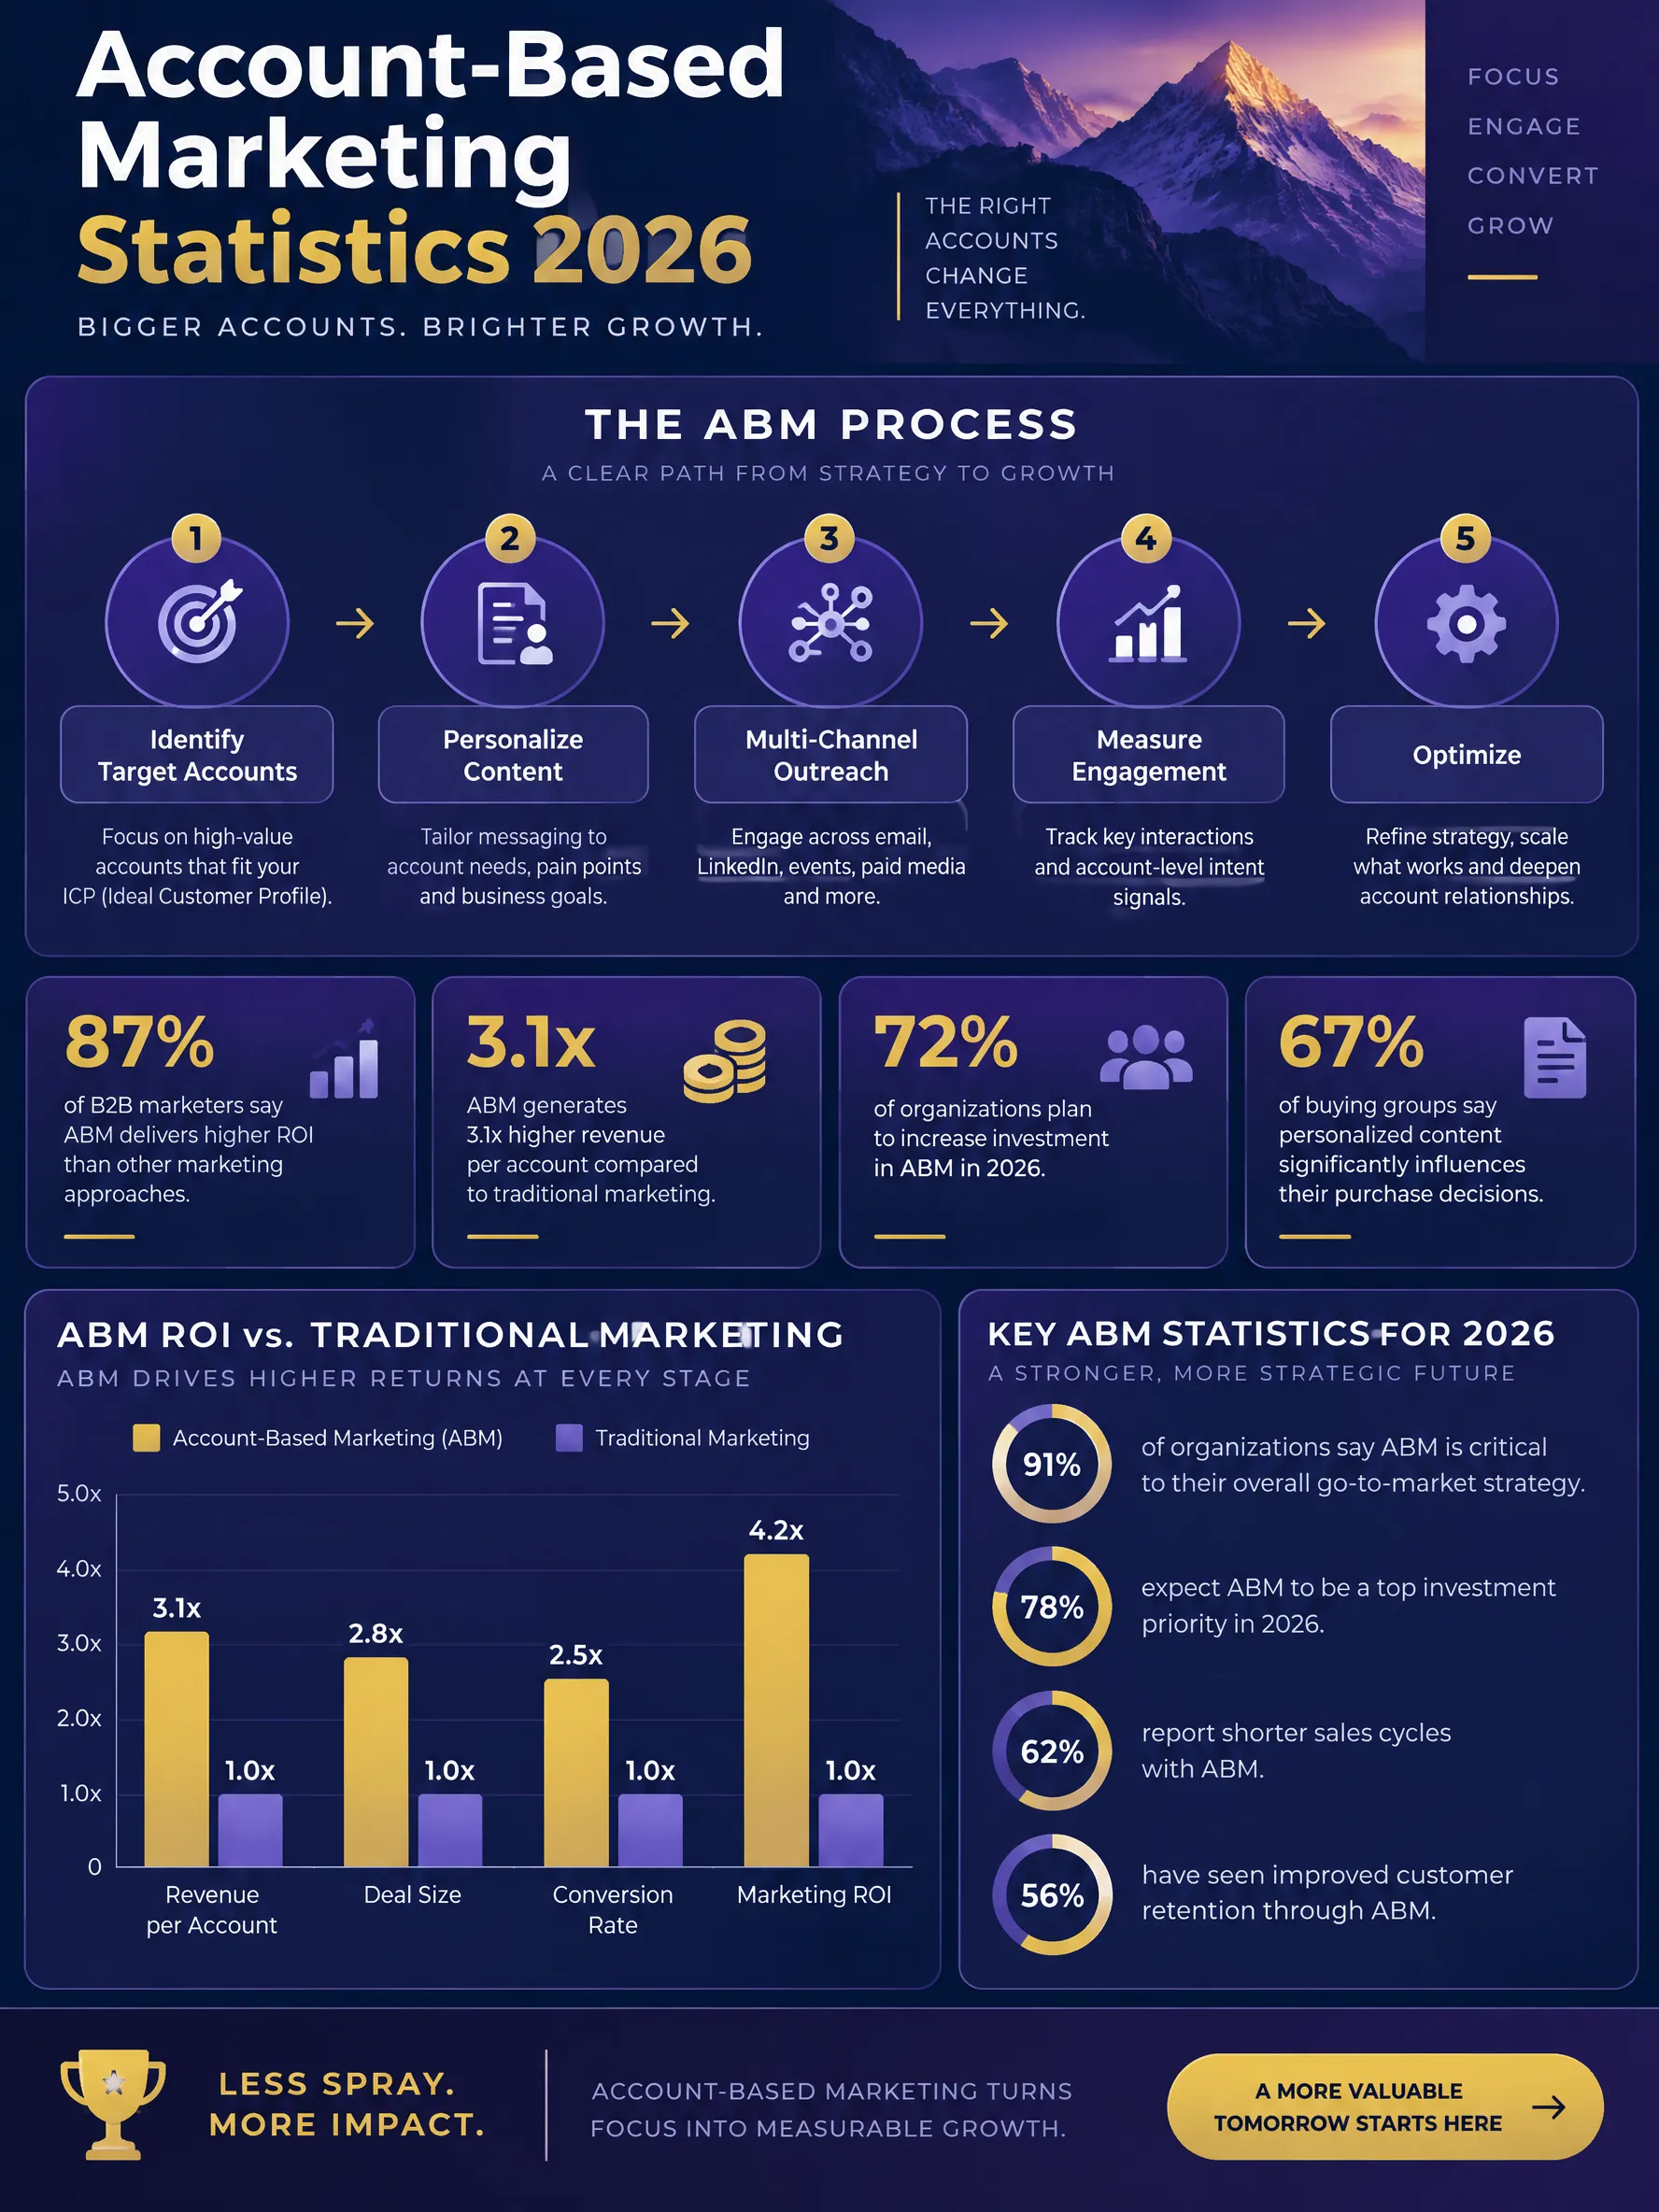
ABM strategy process, ROI benchmarks, adoption rates, technology stack, and performance comparison versus traditional demand generation approaches.
Published
Generate a custom version of this infographic
Customize with your own data, style, and branding
Generate This InfographicProcess Steps
How Account-Based Marketing Statistics 2026
Account-Based Marketing (ABM) has evolved from an experimental B2B tactic to the dominant go-to-market strategy for enterprise software and professional services companies. In 2026, 87% of B2B marketers report that ABM outperforms all other marketing investments in terms of ROI, and the global ABM platform market reached $1.6 billion. This process-focused overview explains how ABM works, the data behind its effectiveness, and the step-by-step workflow that drives results.
The ABM process follows a systematic workflow. Step 1: Ideal Customer Profile (ICP) Definition — analyzing your best existing customers to identify firmographic (industry, company size, revenue), technographic (technology stack, tools used), and behavioral (engagement signals, intent data) attributes that define high-value prospects. Companies using data-driven ICPs see 68% higher win rates. Step 2: Target Account Selection — using intent data providers (Bombora, 6sense, Demandbase) and predictive analytics to identify companies actively researching solutions in your category. Top-performing ABM programs target 100-500 accounts simultaneously. Step 3: Account Intelligence — researching each target account's organizational structure, key stakeholders (average B2B buying committee: 6-10 decision-makers), current challenges, competitive landscape, and buying triggers. Step 4: Personalized Content & Campaigns — creating custom messaging, landing pages, case studies, and ad creatives tailored to each account's specific situation. Personalized ABM content generates 3x higher engagement than generic alternatives.
Step 5: Multi-Channel Orchestration — coordinating outreach across LinkedIn (advertising + InMail), programmatic display ads, personalized email sequences, direct mail, executive events, and sales outreach. The average ABM program uses 5-7 channels simultaneously. ABM programs integrating 6+ channels report 47% higher pipeline generation. Step 6: Sales and Marketing Alignment — ensuring seamless handoffs through shared account data, joint account planning sessions, and unified CRM records. Companies with tightly aligned sales and marketing teams achieve 208% higher marketing-attributed revenue. Step 7: Measurement and Optimization — tracking account-level metrics including engagement scores, pipeline velocity, deal size, and win rates rather than traditional lead-volume metrics.
The performance data is compelling. ABM delivers 97% higher ROI than traditional demand generation according to Forrester. Average deal sizes for ABM-targeted accounts are 171% larger than non-ABM deals. Pipeline-to-close rates improve from an industry average of 18% to 32% with ABM. Customer lifetime value for ABM-acquired accounts is 35% higher. ABM programs that have been running for 2+ years report average annual contract values 28% above organizational benchmarks. The median payback period for ABM investment is 7 months.
Technology powers modern ABM at scale. The core ABM tech stack includes: intent data platforms ($600M market — 6sense, Bombora, TechTarget), ABM orchestration platforms ($450M market — Demandbase, Terminus, RollWorks), personalization engines (Uberflip, PathFactory, Folloze), sales engagement platforms (Outreach, SalesLoft, Apollo), and conversation intelligence (Gong, Chorus). AI is transforming ABM in 2026: predictive models identify 40% more qualified accounts than manual selection, generative AI creates personalized content at scale, and automated orchestration platforms manage multi-channel campaigns with minimal manual intervention.
Frequently Asked Questions
What is account-based marketing (ABM)?
How much does ABM cost to implement?
What metrics should I track for ABM?
Sources
- ITSMA/ABM Leadership Alliance, ABM Benchmark Study, 2026
- Forrester Research, ABM ROI Analysis, 2025
- Demandbase, State of ABM Report, 2026
- 6sense, Revenue AI Benchmark Report, 2026
- Gartner, B2B Buying Journey Research, 2025
Source links go to each publisher's official website.
Embed This Infographic
Copy the code below to share this infographic on your website
<a href="https://www.makeinfographics.ai/infographic/account-based-marketing-statistics-2026" target="_blank" rel="noopener">
  <img src="https://www.makeinfographics.ai/images/infographics/abm-marketing.webp"
       alt="Account-Based Marketing Statistics 2026 — ABM strategy process, ROI benchmarks, adoption rates, technology stack, and performance comparison v"
       width="960" height="1280" loading="lazy"
       style="max-width:100%;height:auto;" />
</a>
<p>Source: <a href="https://www.makeinfographics.ai">MakeInfographics.ai</a> — Free AI Infographic Generator</p>
Create Your Own Account-Based Marketing Statistics 2026 Infographic
Customize this topic with your own data, style, and branding
Create Custom Version — FreeRelated Infographics
All Marketing infographics →Social Media Marketing Strategy
Social media marketing guide: platform demographics, optimal posting times, content performance benchmarks, and ROI data for brands in 2026.
The Evolution of Content Marketing: From Print to AI
A comprehensive timeline tracing content marketing from its 1895 origins with John Deere's The Furrow through the rise of blogs, social media, video-first strategies, and the 2022–2026 AI revolution reshaping a $524 billion global industry.
Email Marketing Statistics & Best Practices 2026
Essential email marketing metrics including open rates by industry, optimal send times, subject line strategies, automation ROI, and deliverability benchmarks for marketers.
Influencer Marketing Industry Statistics 2026
Data-driven overview of the $24 billion influencer marketing industry covering ROI benchmarks, platform performance, engagement rates by follower tier, and emerging trends.