

History of E-Commerce: Online Shopping Milestones Timeline Infographic
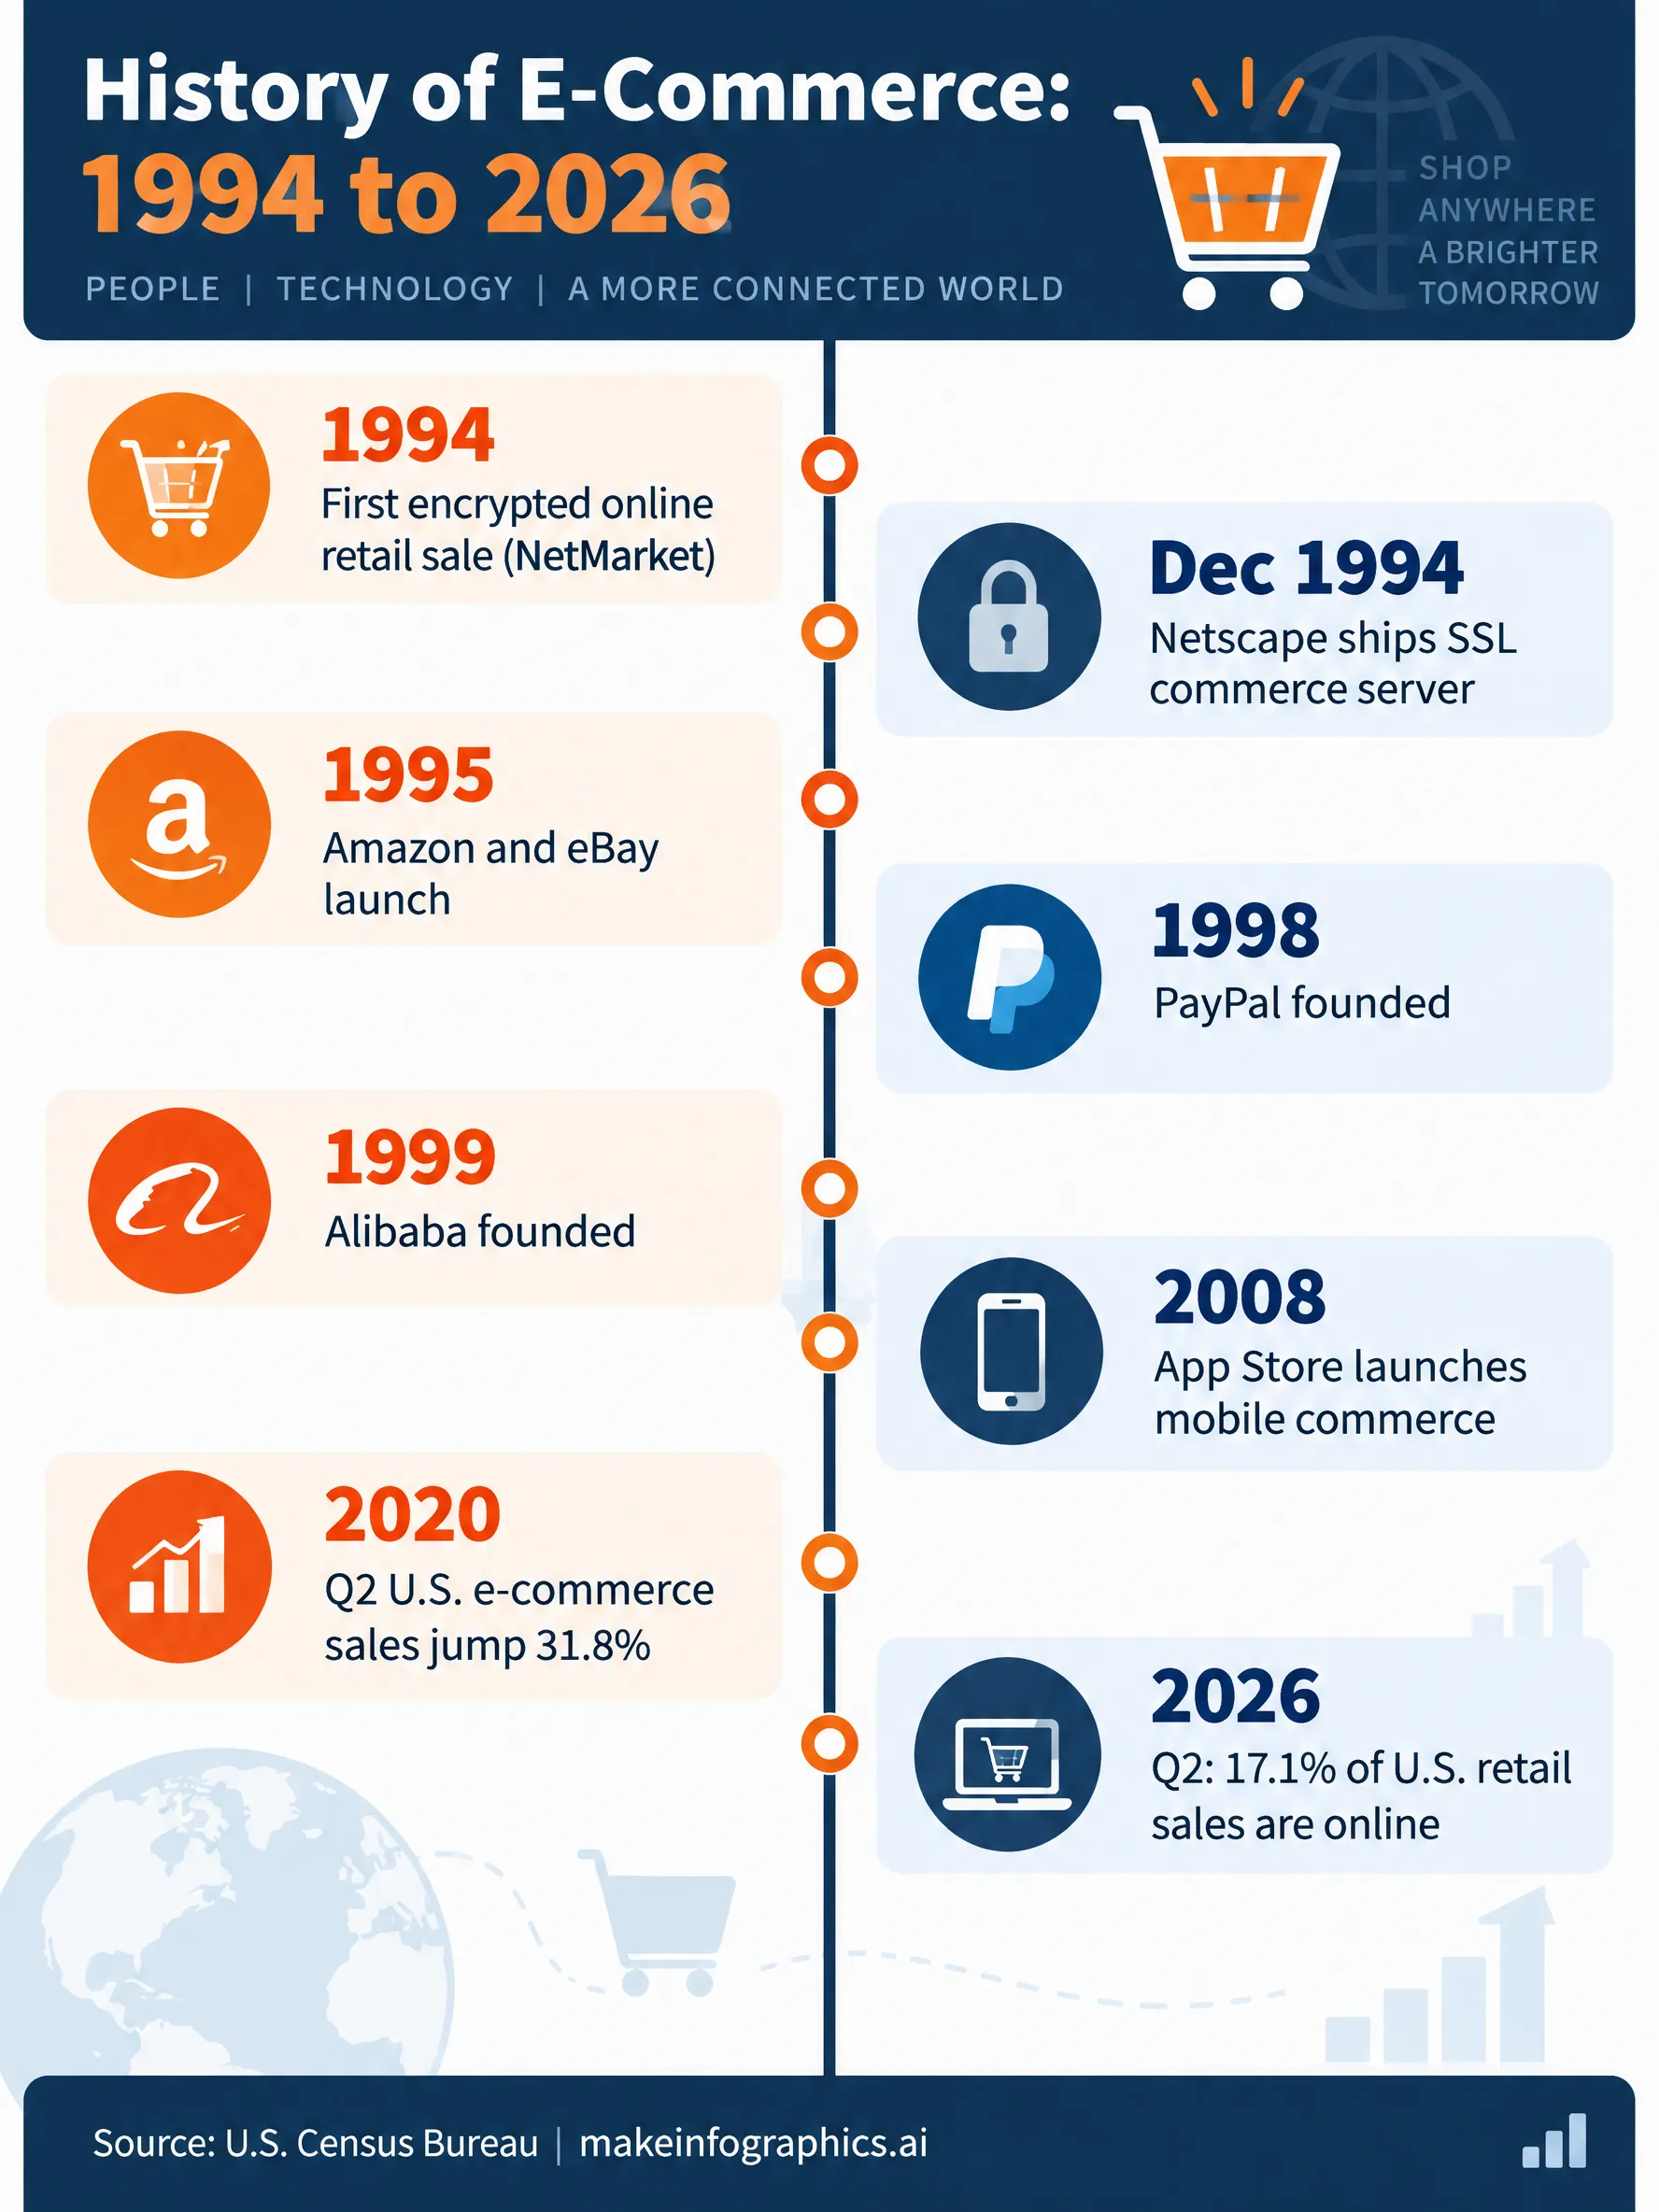
E-commerce history timeline from the first secure 1994 online sale to Q2 2026, when U.S. retail e-commerce reached 17.1% of total sales (Census Bureau).
Published
Generate a custom version of this infographic
Customize with your own data, style, and branding
Generate This InfographicKey Milestones
Timeline of History of E-Commerce: Online Shopping Milestones Timeline
E-commerce did not begin with a shopping cart icon. It began with a trust problem: how could strangers exchange money and goods across a network built for researchers? The milestone timeline from 1994 to today is really a story of encryption, marketplaces, mobile software, and finally measurement—each layer removing friction that kept retail offline.
The breakthrough sale came on August 11, 1994, when Phil Brandenberger used encryption software to buy a Sting CD through the NetMarket site operated from Nashua, New Hampshire. Contemporary reporting treated the event as proof that strong cryptography could protect a card number in transit, not as a novelty stunt. That distinction matters for founders today: the first win was security and settlement, not merchandising polish.
Browser and server security followed quickly. On December 15, 1994, Netscape Communications shipped Netscape Navigator 1.0 alongside its Netsite Commerce Server with Secure Sockets Layer technology. Marc Andreessen’s team framed the release as making the Internet “open for business” because both sides of a session could encrypt traffic and authenticate the merchant. SSL did not replace earlier experiments, but it standardized the pattern behind HTTPS checkout flows merchants still rely on.
Marketplaces turned technical possibility into habit. Amazon.com opened in July 1995 as an online bookseller from Jeff Bezos’s Bellevue, Washington, home, and eBay founder Pierre Omidyar launched AuctionWeb over Labor Day weekend that same year, later renamed eBay. Amazon optimized selection and fulfillment scale; eBay proved that peer listings and reputation systems could monetize the long tail. Payment friction remained the bottleneck until digital wallets matured.
PayPal, founded in December 1998, popularized email-linked payments that matched the speed auction buyers expected. Alibaba Group, founded in 1999 in Hangzhou by Jack Ma and 17 co-founders, focused on connecting small exporters with global wholesale buyers through Alibaba.com— a different wedge than U.S. consumer marketplaces, but equally influential for cross-border trade.
Mobile commerce accelerated when software distribution moved to pocket screens. Apple announced more than 500 native App Store applications on July 10, 2008, ahead of the iPhone 3G launch, giving retailers a controlled channel for storefront apps, push alerts, and wallet integrations. Census definitions now explicitly include orders placed on mobile devices, reflecting how m-commerce became part of baseline reporting rather than a separate niche.
Macro shocks rewired channel mix. During the COVID-19 pandemic, Census Bureau quarterly data showed U.S. retail e-commerce sales rising 31.8 percent from the first to the second quarter of 2020 while total retail sales fell 3.9 percent, pushing the e-commerce share of adjusted retail from 11.4 percent to 15.7 percent in that span. The surge was policy- and behavior-driven—closed stores, stimulus, and habit formation—not a gradual trend line.
By the second quarter of 2026, the same Census series estimated seasonally adjusted U.S. retail e-commerce at $340.2 billion, 17.1 percent of total retail sales of $1,986.5 billion, up 12.2 percent year over year. Longer arcs put the scale in perspective: Census analysis noted e-commerce was just 0.6 percent of adjusted U.S. retail in the fourth quarter of 1999.
For operators building in 2026, the timeline implies priorities rather than nostalgia. Trust infrastructure still converts: TLS, fraud tools, and clear return policies remain table stakes. Marketplace dynamics mean differentiation shifts to brand, logistics, and data—not merely listing products. Mobile-first UX is assumed. Finally, treat Census share figures as planning benchmarks, not ceilings; they exclude many travel and financial transactions yet define how investors and boards judge retail mix.
Use this infographic as a sequencing map: secure transaction, scalable discovery, fast settlement, global supply access, mobile distribution, shock absorption, and transparent measurement. Each milestone solved a specific choke point; the next innovations will target fulfillment cost, identity, and AI-assisted merchandising rather than repeating the same checkout button.
Frequently Asked Questions
What was the first secure online purchase?
Why did Netscape Navigator matter for e-commerce?
How did Amazon and eBay differ in the 1990s?
What role did PayPal and Alibaba play?
How did COVID-19 and mobile change the channel mix?
What share of U.S. retail is e-commerce today?
Sources
- U.S. Census Bureau, Quarterly Retail E-Commerce Sales, 2026
- U.S. Census Bureau, Quarterly Retail E-Commerce Sales, 2020
- The New York Times, Attention Shoppers Internet Is Open, 1994
- University of Calgary, WWW-TALK Archive: Netscape Navigator 1.0 Press Release, 1994
- About Amazon, Amazon Company History, 2025
Source links go to each publisher's official website.
Embed This Infographic
Copy the code below to share this infographic on your website
<a href="https://www.makeinfographics.ai/infographic/ecommerce-history-timeline-online-shopping-milestones" target="_blank" rel="noopener">
  <img src="https://pic-cdn.chibistyle.app/infographics/infographics/ecommerce-history-timeline.webp"
       alt="History of E-Commerce: Online Shopping Milestones Timeline — E-commerce history timeline from the first secure 1994 online sale to Q2 2026, when U.S. retail e-co"
       width="960" height="1280" loading="lazy"
       style="max-width:100%;height:auto;" />
</a>
<p>Source: <a href="https://www.makeinfographics.ai">MakeInfographics.ai</a> — Free AI Infographic Generator</p>
Create Your Own History of E-Commerce: Online Shopping Milestones Timeline Infographic
Customize this topic with your own data, style, and branding
Create Custom Version — FreeRelated Infographics
All E-Commerce infographics →E-Commerce Returns & Reverse Logistics Statistics 2026
Returns data: $820B annual return volume, return rates by category, environmental impact, reverse logistics costs, and restocking technology trends.
Cross-Border E-Commerce Growth Statistics 2026
Cross-border e-commerce reached $2.1T in 2026 (22% of online sales); 2.3B shoppers bought abroad, with 73% of orders on mobile.
Voice Commerce & Smart Shopping Statistics 2026
Voice commerce data: $164B market, smart speaker adoption, shopping category breakdown, conversion metrics, and consumer trust analysis.
Social Commerce & Live Shopping Statistics 2026
Social commerce hit $1.7T in 2026; live shopping converts at 10-15%, TikTok Shop US GMV surged, and Gen Z leads in-app buying.