

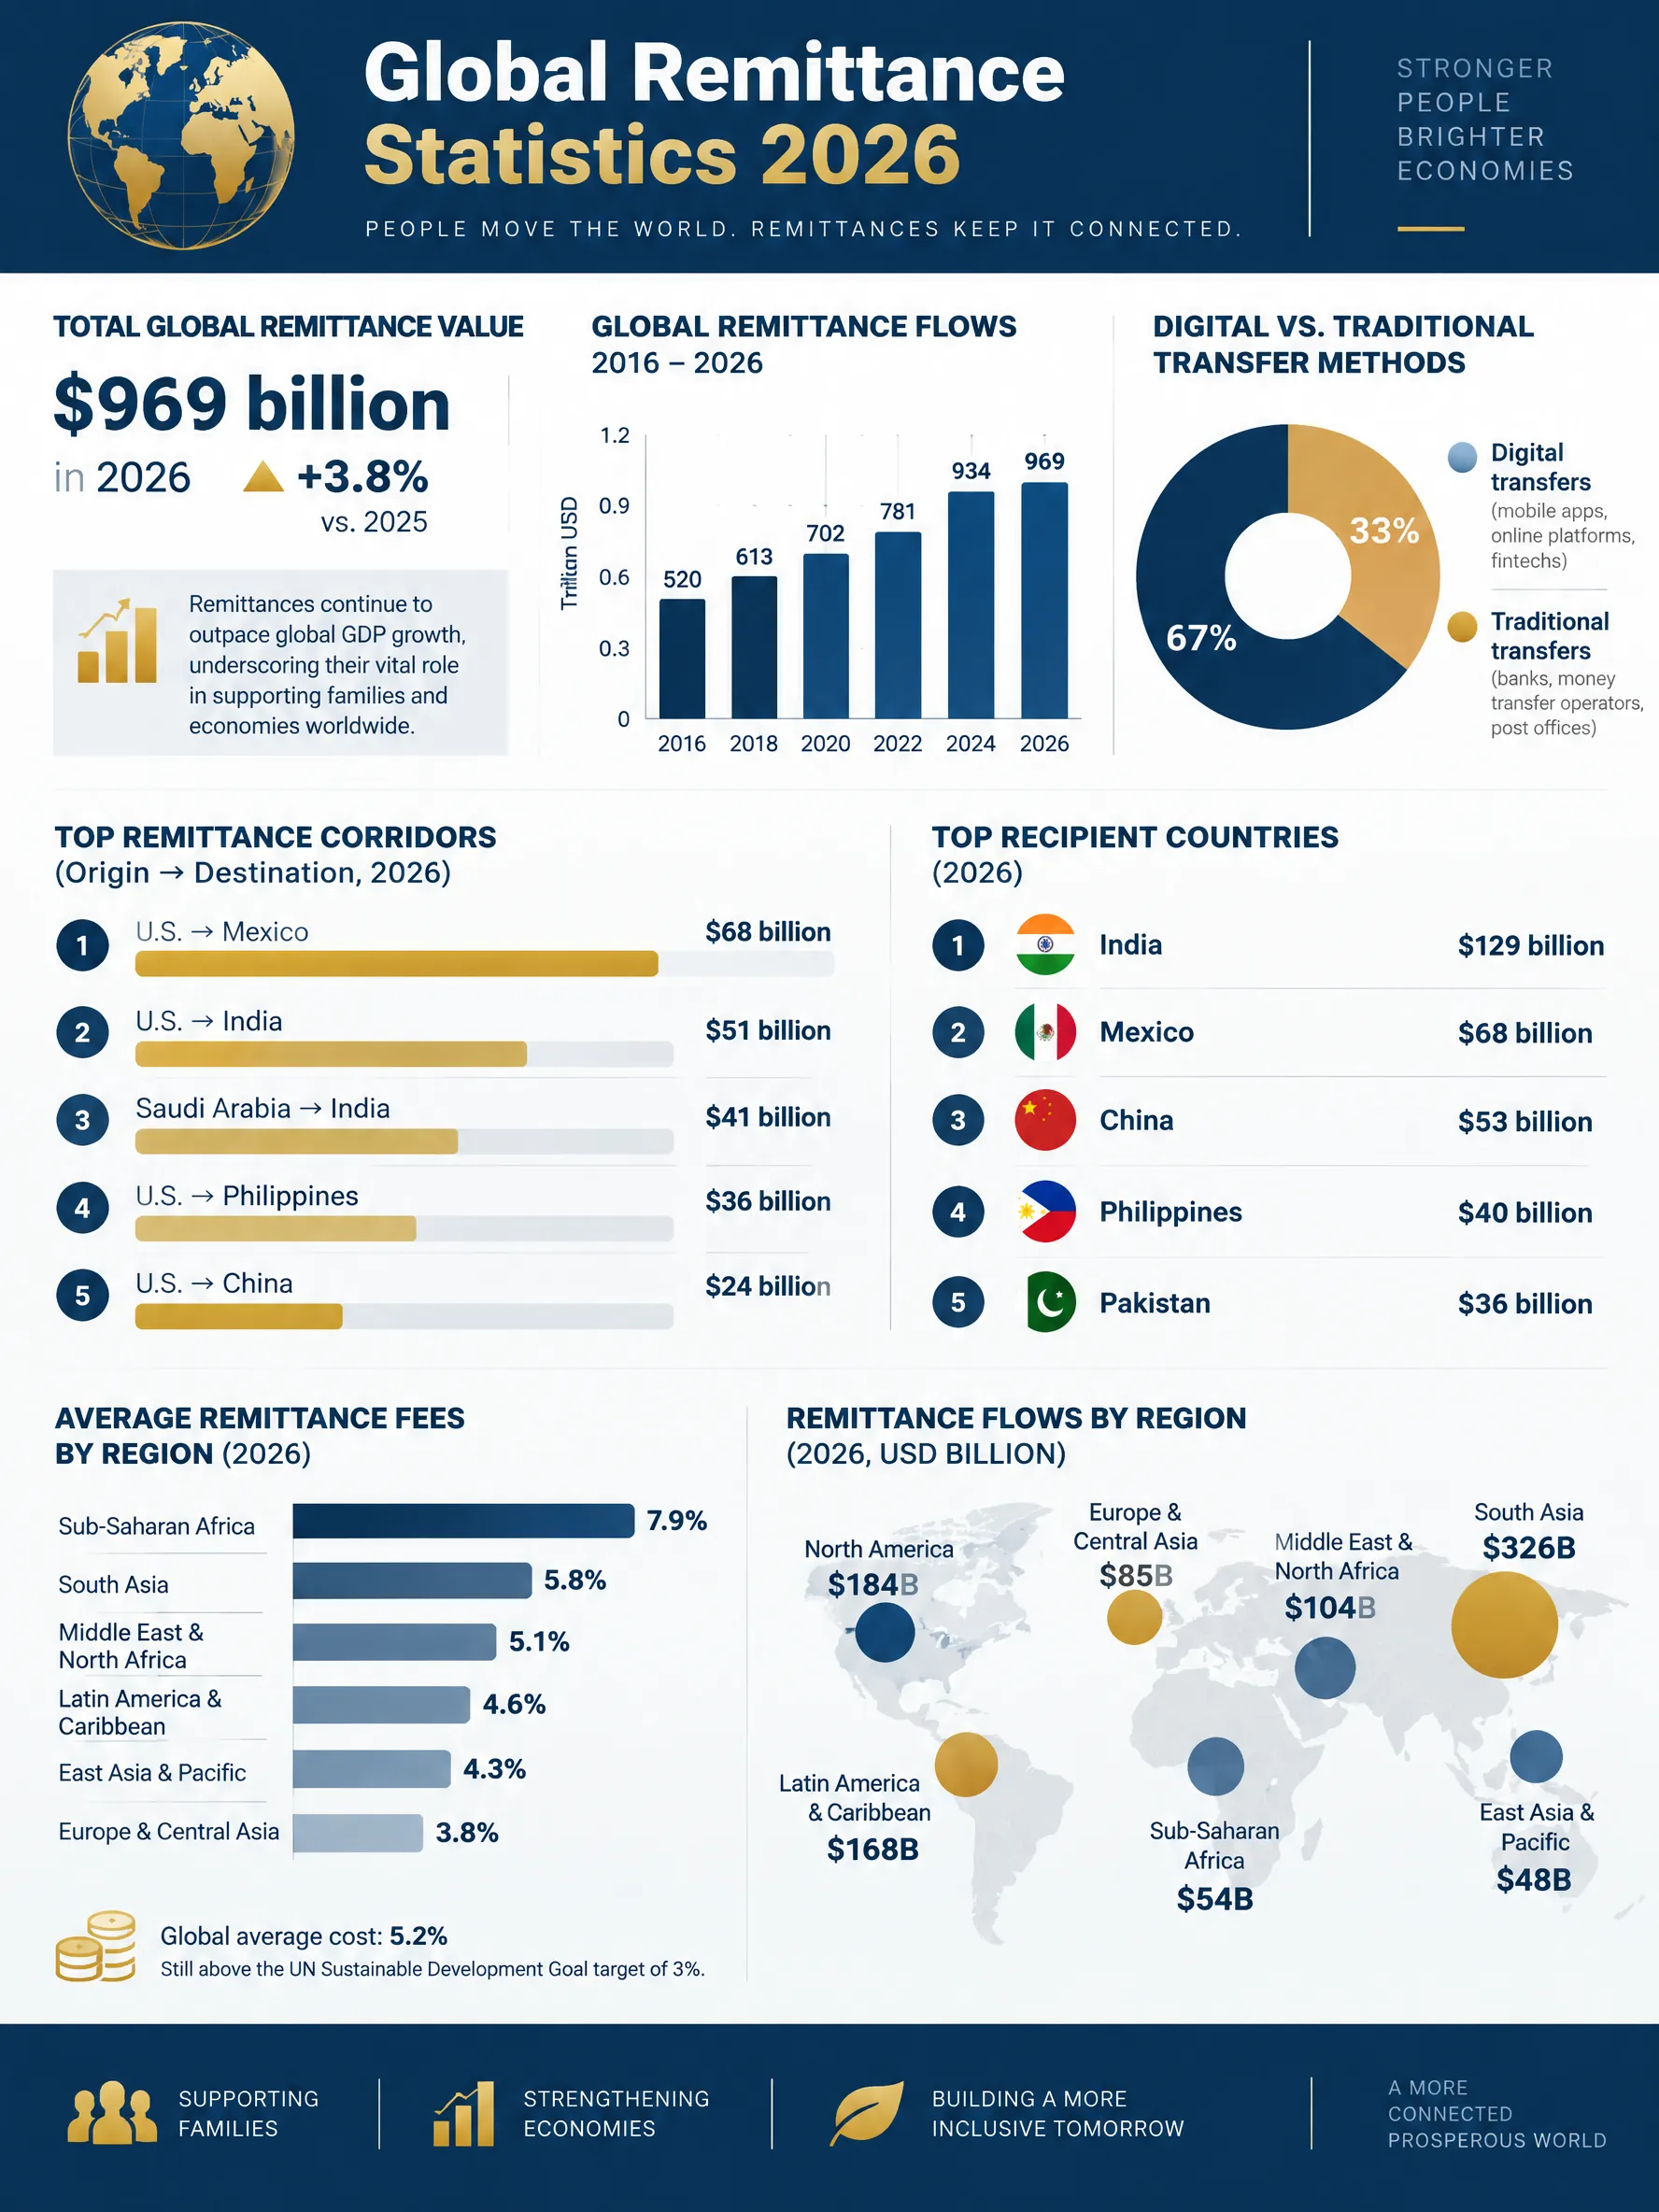
Global Remittance Statistics 2026 Infographic
International money transfer market overview: total flows, top corridors, digital vs traditional methods, average fees by region, and recipient country impact data.
Published
Generate a custom version of this infographic
Customize with your own data, style, and branding
Generate This InfographicKey Statistics
- 1Global remittances reached $860 billion in 2026, surpassing FDI to developing countries (World Bank, 2026)
- 2India is the top recipient at $125 billion; US is the largest source at $78 billion outflows (World Bank, 2026)
- 3Digital channels now account for 58% of remittance flows, up from 15% in 2019 (GSMA, 2026)
- 4Average remittance cost declined to 4.2%, but remains above the 3% SDG target (World Bank Remittance Prices, 2026)
- 5Remittances sustain approximately 800 million people worldwide (IFAD, 2025)
- 6A 10% increase in remittances reduces poverty headcount by 3.5% (World Bank research, 2025)
- 7Cryptocurrency-based remittances hold 4% market share, growing in unbanked corridors (Chainalysis, 2026)
About Global Remittance Statistics 2026
Global remittances — money sent by migrant workers to their home countries — reached a record $860 billion in 2026, surpassing foreign direct investment and official development aid combined as the largest source of external financing for developing economies. This massive flow of capital sustains roughly 800 million people worldwide, funding education, healthcare, housing, and small business development in receiving communities.
The top remittance-receiving countries reflect global migration patterns. India leads at $125 billion annually, followed by Mexico ($68 billion), China ($52 billion), the Philippines ($40 billion), Egypt ($33 billion), Pakistan ($31 billion), Bangladesh ($25 billion), Nigeria ($22 billion), Guatemala ($20 billion), and Vietnam ($18 billion). For several nations, remittances constitute a substantial share of GDP: Tonga (44%), Lebanon (38%), Tajikistan (32%), Nepal (24%), Honduras (22%), and El Salvador (21%). The United States is the largest source country, originating $78 billion in outflows, followed by the UAE ($47 billion), Saudi Arabia ($39 billion), the UK ($22 billion), and Germany ($19 billion).
The digital transformation of remittances has accelerated dramatically. Digital remittance channels (mobile apps, online platforms) now account for 58% of total flows, up from 15% in 2019. Average transfer costs have declined from 6.8% in 2019 to 4.2% in 2026, though they remain above the UN Sustainable Development Goal target of 3%. The most expensive corridors charge 10-15% (Sub-Saharan Africa intra-regional), while the cheapest fall below 2% (UAE to India, Singapore to Philippines). Leading digital platforms include Wise (TransferWise), Remitly, WorldRemit, and mobile money operators like M-Pesa (serving 65 million users across Africa). Cryptocurrency-based remittance services have carved out 4% market share, particularly in corridors with limited banking infrastructure.
The economic multiplier effect of remittances is substantial. World Bank research shows that a 10% increase in remittances to a country reduces the poverty headcount by 3.5%. Remittance-receiving households spend 30% more on education and 20% more on healthcare than comparable non-receiving households. In rural areas, remittances fund 15% of small business startups. However, dependency risks exist: countries heavily reliant on remittances face vulnerability to economic downturns in source countries, exchange rate fluctuations, and geopolitical disruptions to migration corridors. Central banks in receiving countries must manage the inflationary pressure of large foreign currency inflows.
Regulatory developments are reshaping the landscape. Anti-money laundering (AML) and know-your-customer (KYC) regulations have increased compliance costs for money transfer operators, contributing to bank de-risking that has closed correspondent banking relationships in several developing regions. Open banking regulations in the EU and UK are enabling new fintech entrants to access payment infrastructure. The G20's commitment to reducing remittance costs continues to drive policy reforms, including licensing digital-only operators, expanding mobile money interoperability, and promoting transparent pricing.
Frequently Asked Questions
Which countries receive the most remittances?
What is the cheapest way to send money internationally?
How do remittances affect developing economies?
Sources
- World Bank, Migration and Remittances Data, 2026
- GSMA, State of the Mobile Money Industry, 2026
- World Bank, Remittance Prices Worldwide, Q2 2026
- International Fund for Agricultural Development (IFAD), Sending Money Home Report, 2025
- Chainalysis, Crypto Remittance Market Report, 2026
Source links go to each publisher's official website.
Embed This Infographic
Copy the code below to share this infographic on your website
<a href="https://www.makeinfographics.ai/infographic/global-remittance-money-transfer-statistics-2026" target="_blank" rel="noopener">
  <img src="https://www.makeinfographics.ai/images/infographics/global-remittance.webp"
       alt="Global Remittance Statistics 2026 — International money transfer market overview: total flows, top corridors, digital vs traditional met"
       width="960" height="1280" loading="lazy"
       style="max-width:100%;height:auto;" />
</a>
<p>Source: <a href="https://www.makeinfographics.ai">MakeInfographics.ai</a> — Free AI Infographic Generator</p>
Create Your Own Global Remittance Statistics 2026 Infographic
Customize this topic with your own data, style, and branding
Create Custom Version — FreeRelated Infographics
All Finance & FinTech infographics →Startup Funding Stages Explained
Startup funding from pre-seed to IPO: typical round sizes, valuations, investor types, dilution rates, and what founders need at each stage.
Personal Finance Budget Planning Checklist
A comprehensive checklist for personal finance budget planning, covering the 50/30/20 rule, expense tracking, emergency funds, debt management, and savings strategies backed by 2025–2026 household spending data.
Cryptocurrency Regulation: Global Landscape 2026
Comprehensive comparison of cryptocurrency regulatory frameworks across major jurisdictions, covering DeFi rules, stablecoin legislation, tax treatment, and enforcement actions.
Global FinTech Adoption Trends 2026
Process overview of fintech adoption worldwide covering digital payments, mobile banking, neobanks, BNPL services, open banking, and embedded finance market growth.