

Startup Funding Stages Explained Infographic
Startup funding from pre-seed to IPO: typical round sizes, valuations, investor types, dilution rates, and what founders need at each stage.
Published
Generate a custom version of this infographic
Customize with your own data, style, and branding
Generate This InfographicKey Milestones
Timeline of Startup Funding Stages Explained
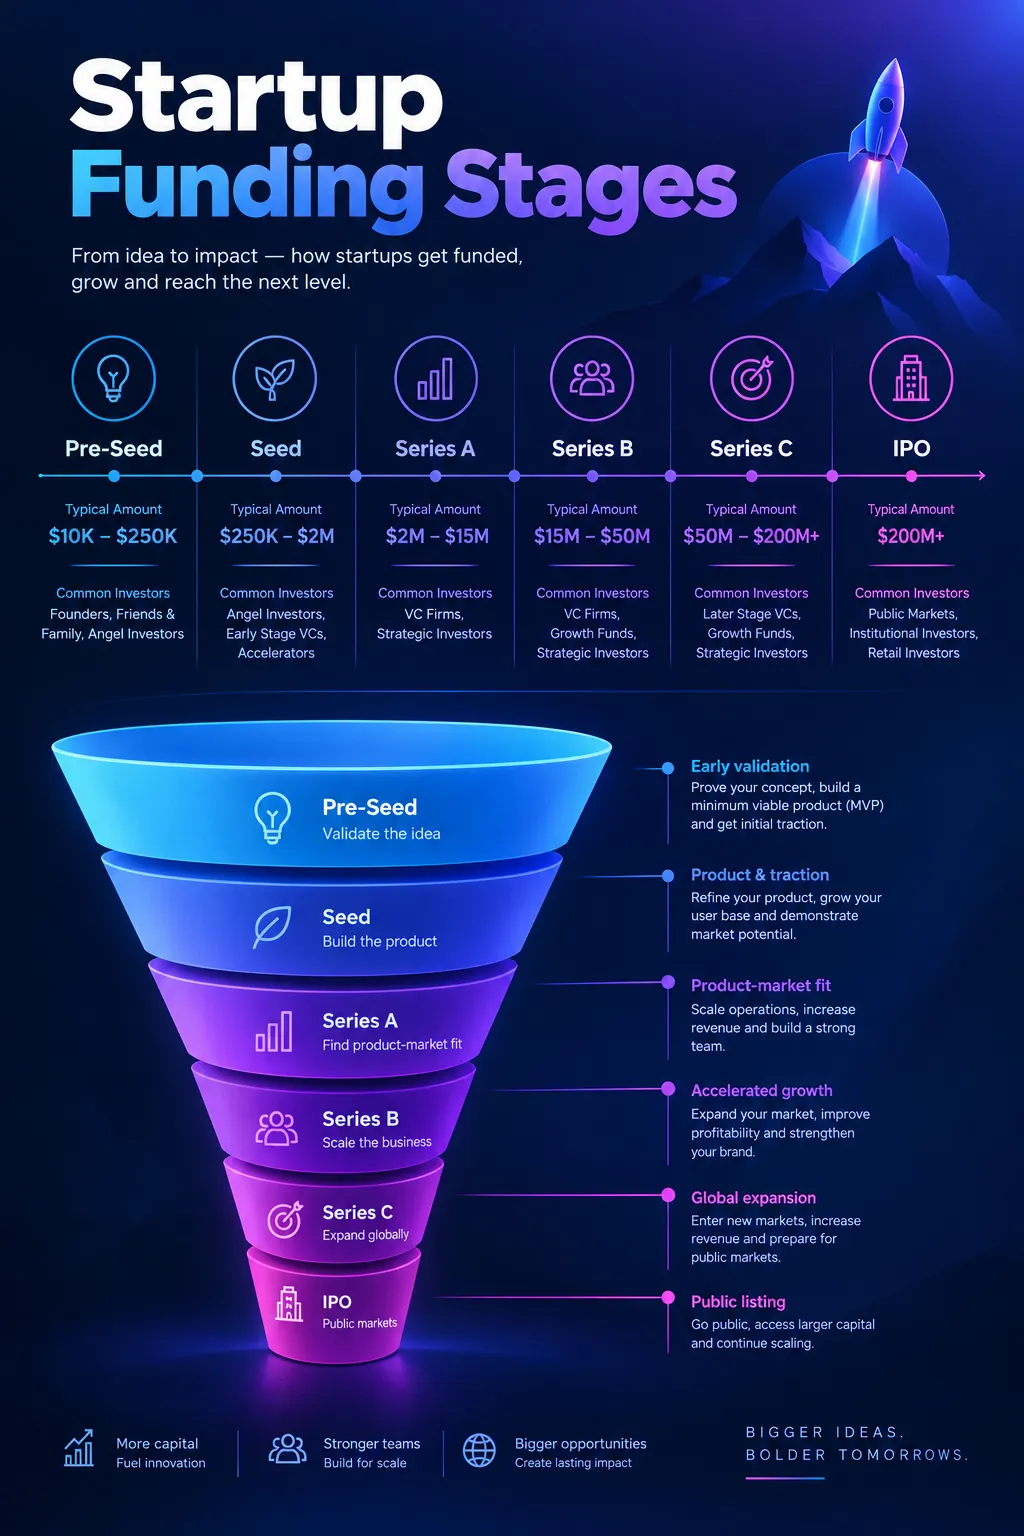
Startup funding follows a structured progression from initial concept validation through public markets, with each stage serving distinct milestones in company growth. Pre-seed rounds, typically $100,000 to $500,000, fund product development and early team building, often sourced from founders, friends, family, and angel investors. Seed rounds range from $500,000 to $3 million and focus on achieving product-market fit with early customer traction
Series A rounds, averaging $10 to $20 million in 2025, scale proven business models with repeatable revenue engines. Convertible notes and SAFE agreements remain popular instruments at early stages, simplifying legal complexity while deferring valuation negotiations. Series B and beyond fund market expansion, with median round sizes exceeding $30 million for growth-stage companies
Late-stage rounds (Series C through E) often exceed $100 million and prepare companies for IPO or acquisition. Global venture capital investment reached approximately $345 billion in 2024, with AI startups capturing a disproportionate share of new funding. Typical founder dilution per round ranges from 15 to 25 percent, making cap table management critical from the earliest stages
Venture debt has grown as a complement to equity rounds, allowing founders to extend runway with less dilution. Understanding each funding stage helps founders time their raises, select appropriate investors, and negotiate terms that preserve long-term equity value.
Instrument choice at pre-seed and seed stages shapes later cap table complexity as much as headline valuation. Convertible notes and SAFE agreements defer pricing but stack liquidation preferences and discount terms that convert into ownership at Series A, often surprising founders who focused only on the initial check size.
Series A bar moved upward with median rounds near $18 million in 2024 compared with about 12 million in 2020. Investors at this stage expect annual recurring revenue approaching or exceeding $1 million, clear unit economics, and eighteen to thirty months of disciplined execution since founding. Global venture capital totaled roughly $345 billion in 2024, with artificial intelligence companies capturing more than 35 percent of new commitments, which concentrates competition for growth rounds in non-AI sectors unless those startups show exceptional margins or defensible data assets.
Dilution discipline and venture debt extend runway without assuming the next round is guaranteed. Founders commonly give up 15 to 25 percent per equity round; cumulative ownership at IPO often lands near 15 to 30 percent for the founding team depending on option pool refreshes and the number of rounds. Venture debt complements equity when revenue is recurring and lenders can underwrite against contracts, letting teams hit milestones before accepting a down round. Only about 1 percent of venture-backed companies reach unicorn valuations, so planning for profitable independence or strategic acquisition at Series B or C is as rational as targeting a public listing.
Investor fit varies by stage in ways term sheets encode. Pre-seed backers bet primarily on team and market insight, seed funds want early traction and customer references, Series A leads demand scalable go-to-market engines, and late-stage funds prioritize market share, governance, and a credible path to public markets or sale. Understanding those shifting criteria helps founders time raises when metrics match the narrative, rather than fundraising solely because runway is short. Down rounds and structured secondaries have become more common when growth slows, making transparent investor communication early in the relationship essential.
Milestone-based planning links each round to the evidence the next investor will demand. Founders who map their runway to a small set of measurable proof points, such as retention cohorts, pipeline conversion, or gross margin, usually raise on better terms than those who raise on a narrative alone. Time between rounds has stretched in recent years, so extending runway through disciplined hiring and clear unit economics matters more than chasing the highest headline valuation. Cap table hygiene also pays off: advisor grants, option pool refreshes, and side letters accumulate and can complicate diligence if they are not tracked carefully from the start.
Frequently Asked Questions
What is the difference between pre-seed and seed funding?
How much equity do founders typically give up per round?
When should a startup raise Series A funding?
What do investors look for at each funding stage?
Sources
- PitchBook/NVCA Venture Monitor, 2024
- CB Insights State of Venture Report, 2024
- Carta Equity Report, 2024
- Crunchbase Global Funding Report, 2024
Source links go to each publisher's official website.
Embed This Infographic
Copy the code below to share this infographic on your website
<a href="https://www.makeinfographics.ai/infographic/startup-funding-stages" target="_blank" rel="noopener">
  <img src="https://pic-cdn.chibistyle.app/infographics/infographics/startup-funding.webp"
       alt="Startup Funding Stages Explained — Startup funding from pre-seed to IPO: typical round sizes, valuations, investor types, dilution rate"
       width="960" height="1440" loading="lazy"
       style="max-width:100%;height:auto;" />
</a>
<p>Source: <a href="https://www.makeinfographics.ai">MakeInfographics.ai</a> — Free AI Infographic Generator</p>
Create Your Own Startup Funding Stages Explained Infographic
Customize this topic with your own data, style, and branding
Create Custom Version — FreeMake Something for Your Own Life
Free printable planners, blank or filled in by AI from your details.

Related Infographics
All Finance & FinTech infographics →Private Equity vs Venture Capital Investment Guide 2026
PE vs VC explained: deal structures, fund sizes, return profiles, portfolio company stages, carried interest, LP composition, and 2026 market trends.
Central Bank Digital Currencies (CBDC) Statistics 2026
134 economies explore CBDCs in 2026; China’s e-CNY passed $300B in volume. Retail vs wholesale models, mBridge, and digital euro timing.
Global Remittance Statistics 2026
Global remittances hit $860B in 2026; India leads receipts at $125B, digital channels are 58% of flows, and average fees fell to 4.2%.
Global Wealth Inequality Statistics 2026
Wealth distribution data: top 1% vs bottom 50% ownership, Gini coefficients by country, billionaire wealth growth, and intergenerational mobility trends.