

Process Infographic Maker: Steps and Workflows
Describe the steps of a process and get a numbered infographic that is easy to follow, with an icon and a short line for each step. Use it for how-tos, onboarding, internal procedures and explainers.
Starts in the Hand Drawn style at 2:3. Tall shapes suit a top-to-bottom flow with four to seven steps. Choose 16:9 for a left-to-right pipeline.
Making a process easy to follow
Number the steps and keep verbs first
“1. Collect the waste” is clearer than “collection”. Starting each step with a verb gives the AI a clean, short label to put under each icon.
Limit it to four to seven steps
A process with more than seven steps is hard to read at a glance. Group small steps together, or show the long version as two infographics.
Mention decisions and who does what
If there is a yes/no decision or a handover between people, say so: “if the test fails, go back to step 3”. The AI can draw branches and role labels.
Three examples to start from
Each one opens in the generator with the style and shape filled in. Edit the details, then press Generate.
How plastic is recycled · Hand Drawn · 2:3
Process infographic: how plastic is recycled in 5 steps. 1 Collection, 2 Sorting by type, 3 Washing and shredding, 4 Melting into pellets, 5 Making new products. An icon and one sentence for each step, with arrows between steps.
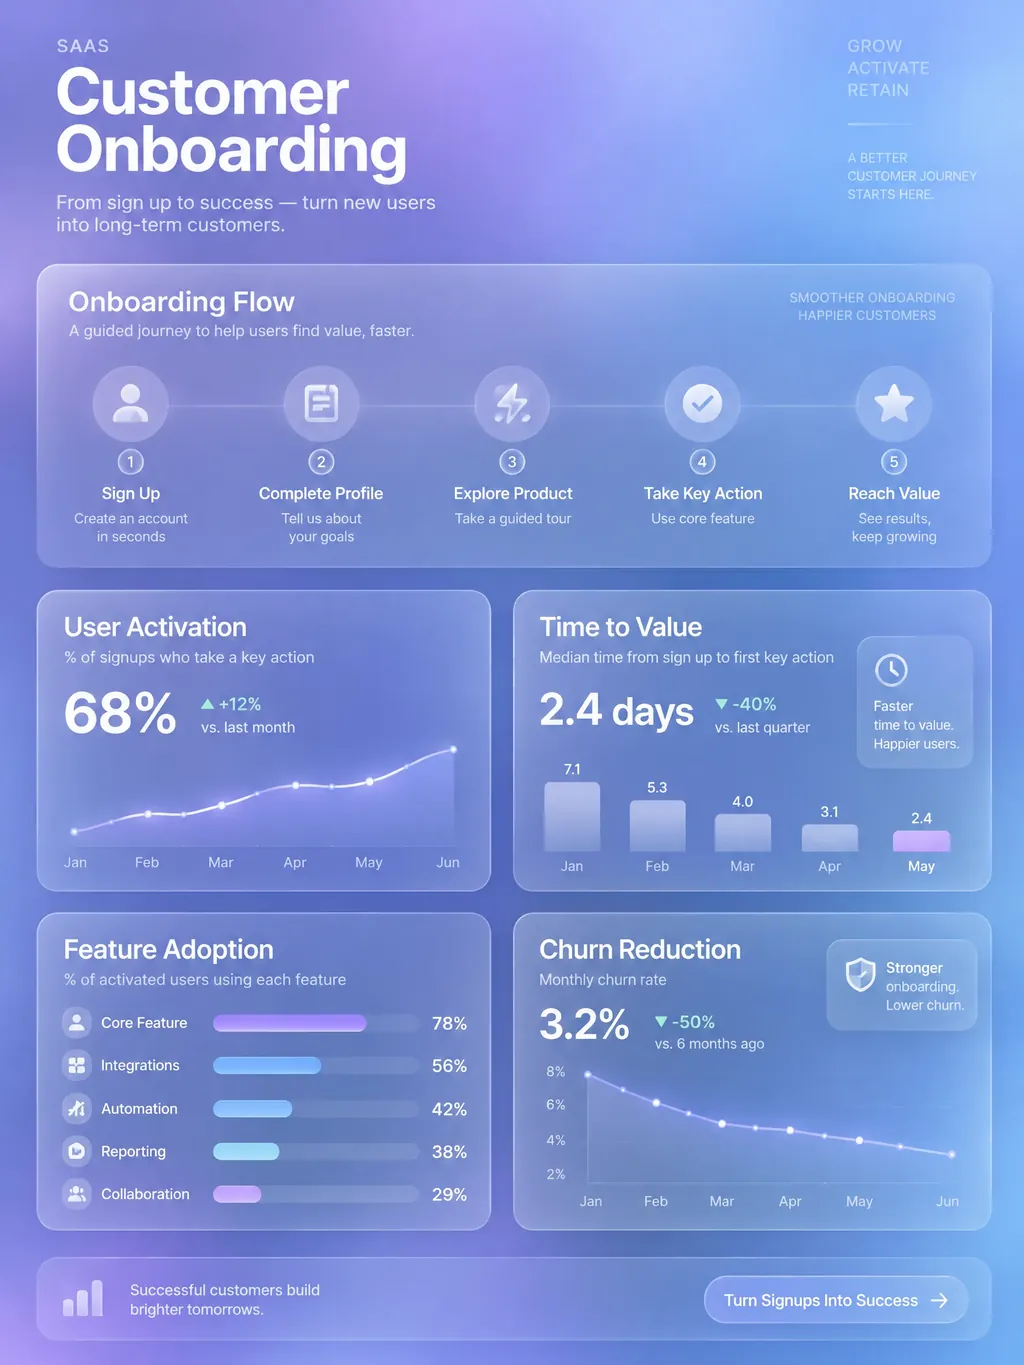
Open in the generator →Customer onboarding flow · Glass · 16:9
Customer onboarding process for a software product: sign up, connect your data, invite your team, set up the first project, review results after one week. Show who is responsible for each step (customer or support) and the expected time.
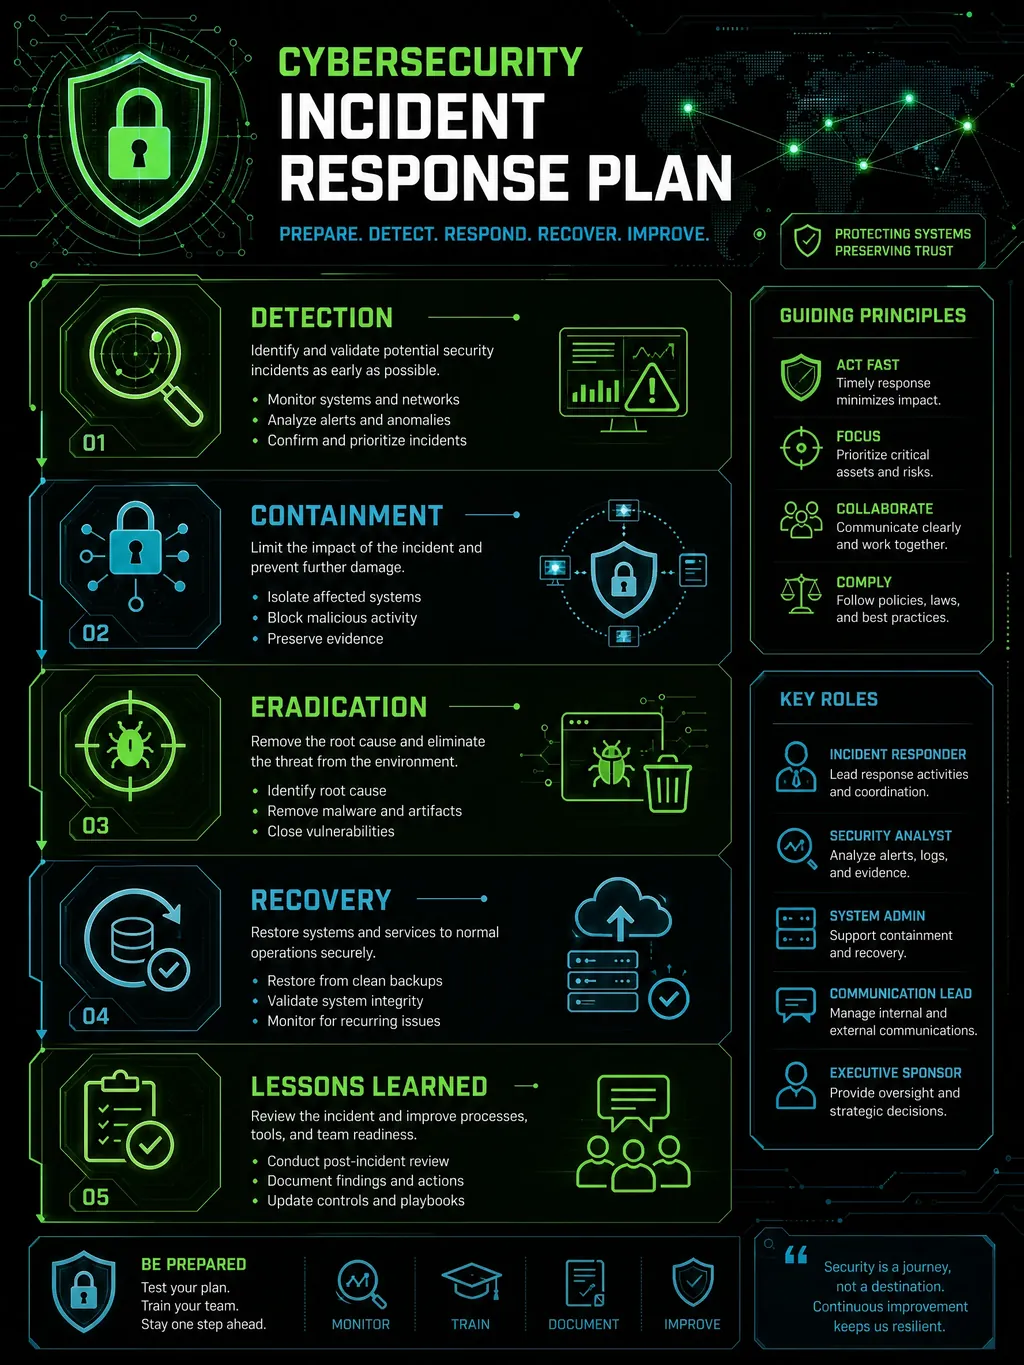
Open in the generator →Incident response checklist · Dark · 2:3
Incident response process in 6 steps: detect, triage, contain, fix, recover, review. Include a decision point after triage (is customer data affected? if yes notify the security lead) and one owner role per step.
Open in the generator →
How it works
- 1
Write the steps in order
One line per step, with the action first. Add the title of the process.
- 2
Pick a style that fits
Hand-drawn feels friendly for how-tos, Tech suits workflows and pipelines, Corporate suits internal procedures.
- 3
Generate and walk through it
Read the steps top to bottom as a new reader would. If a step is missing or in the wrong place, edit the list and regenerate.
Related templates
Ready-made starting points that fit this kind of infographic.

Questions
Can it draw a flowchart with branches?
It can show a decision point and simple branches when you describe them, such as “if it fails, go back to step 3”. For complex flowcharts with many branches, a dedicated diagram tool will give you more control.
How many steps work best?
Four to seven steps are the sweet spot on a single page. Beyond that, group related steps or split the process into stages.
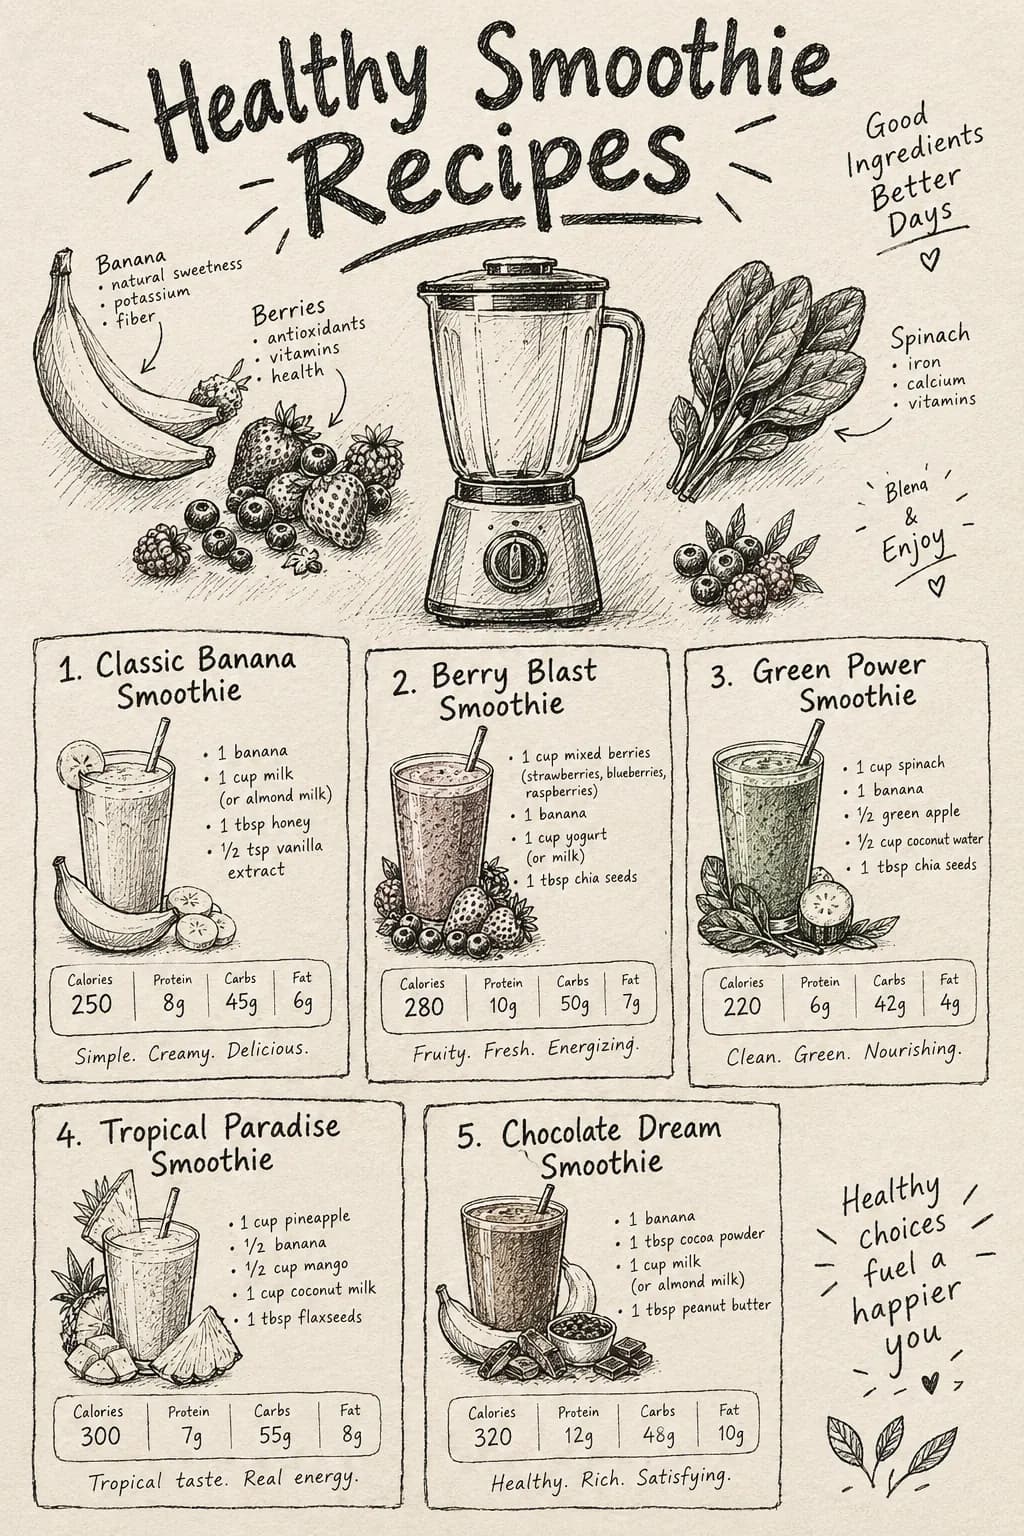
Can I use it for a how-to or recipe?
Yes. Number the steps, list any ingredients or tools at the top, and pick a friendly style such as Hand Drawn. There are also templates for recipes and checklists.
Will it make an editable diagram?
No, the result is a PNG image. If you need to edit boxes and arrows afterwards, use it as a visual draft or regenerate with an updated description.
See the content license and pricing.
Keep reading
Make your first one now
Describe the topic, pick a style and download the result.
Start creatingSecure checkout by Waffo · Cancel any time · Failed generations are refunded