

Turn Your Notes Into an Infographic
Paste meeting notes, lecture notes or a rough outline and get a one-page infographic that keeps your points and handles the layout, icons and hierarchy for you. There is nothing to install and no editor to learn.
Starts in the Minimal style at 2:3. A tall 2:3 page gives notes room to be grouped into sections. Use 16:9 if the result is going onto a slide.
How to write notes the AI can lay out well
Label each group of notes
Start each cluster with a short heading such as Wins, Risks or Next steps. The AI follows your grouping, so each label becomes a section of the page.
Keep the exact numbers, dates and names
Whatever you write is what gets drawn, so include the figures you want shown. AI can occasionally mistype text inside an image, so read the result once before you share it.
Aim for five to eight points
One page holds about that many ideas comfortably. If your notes are longer, split them into two infographics or trim them to what a reader must remember.
Three examples to start from
Each one opens in the generator with the style and shape filled in. Edit the details, then press Generate.
Weekly team update · Minimal · 2:3
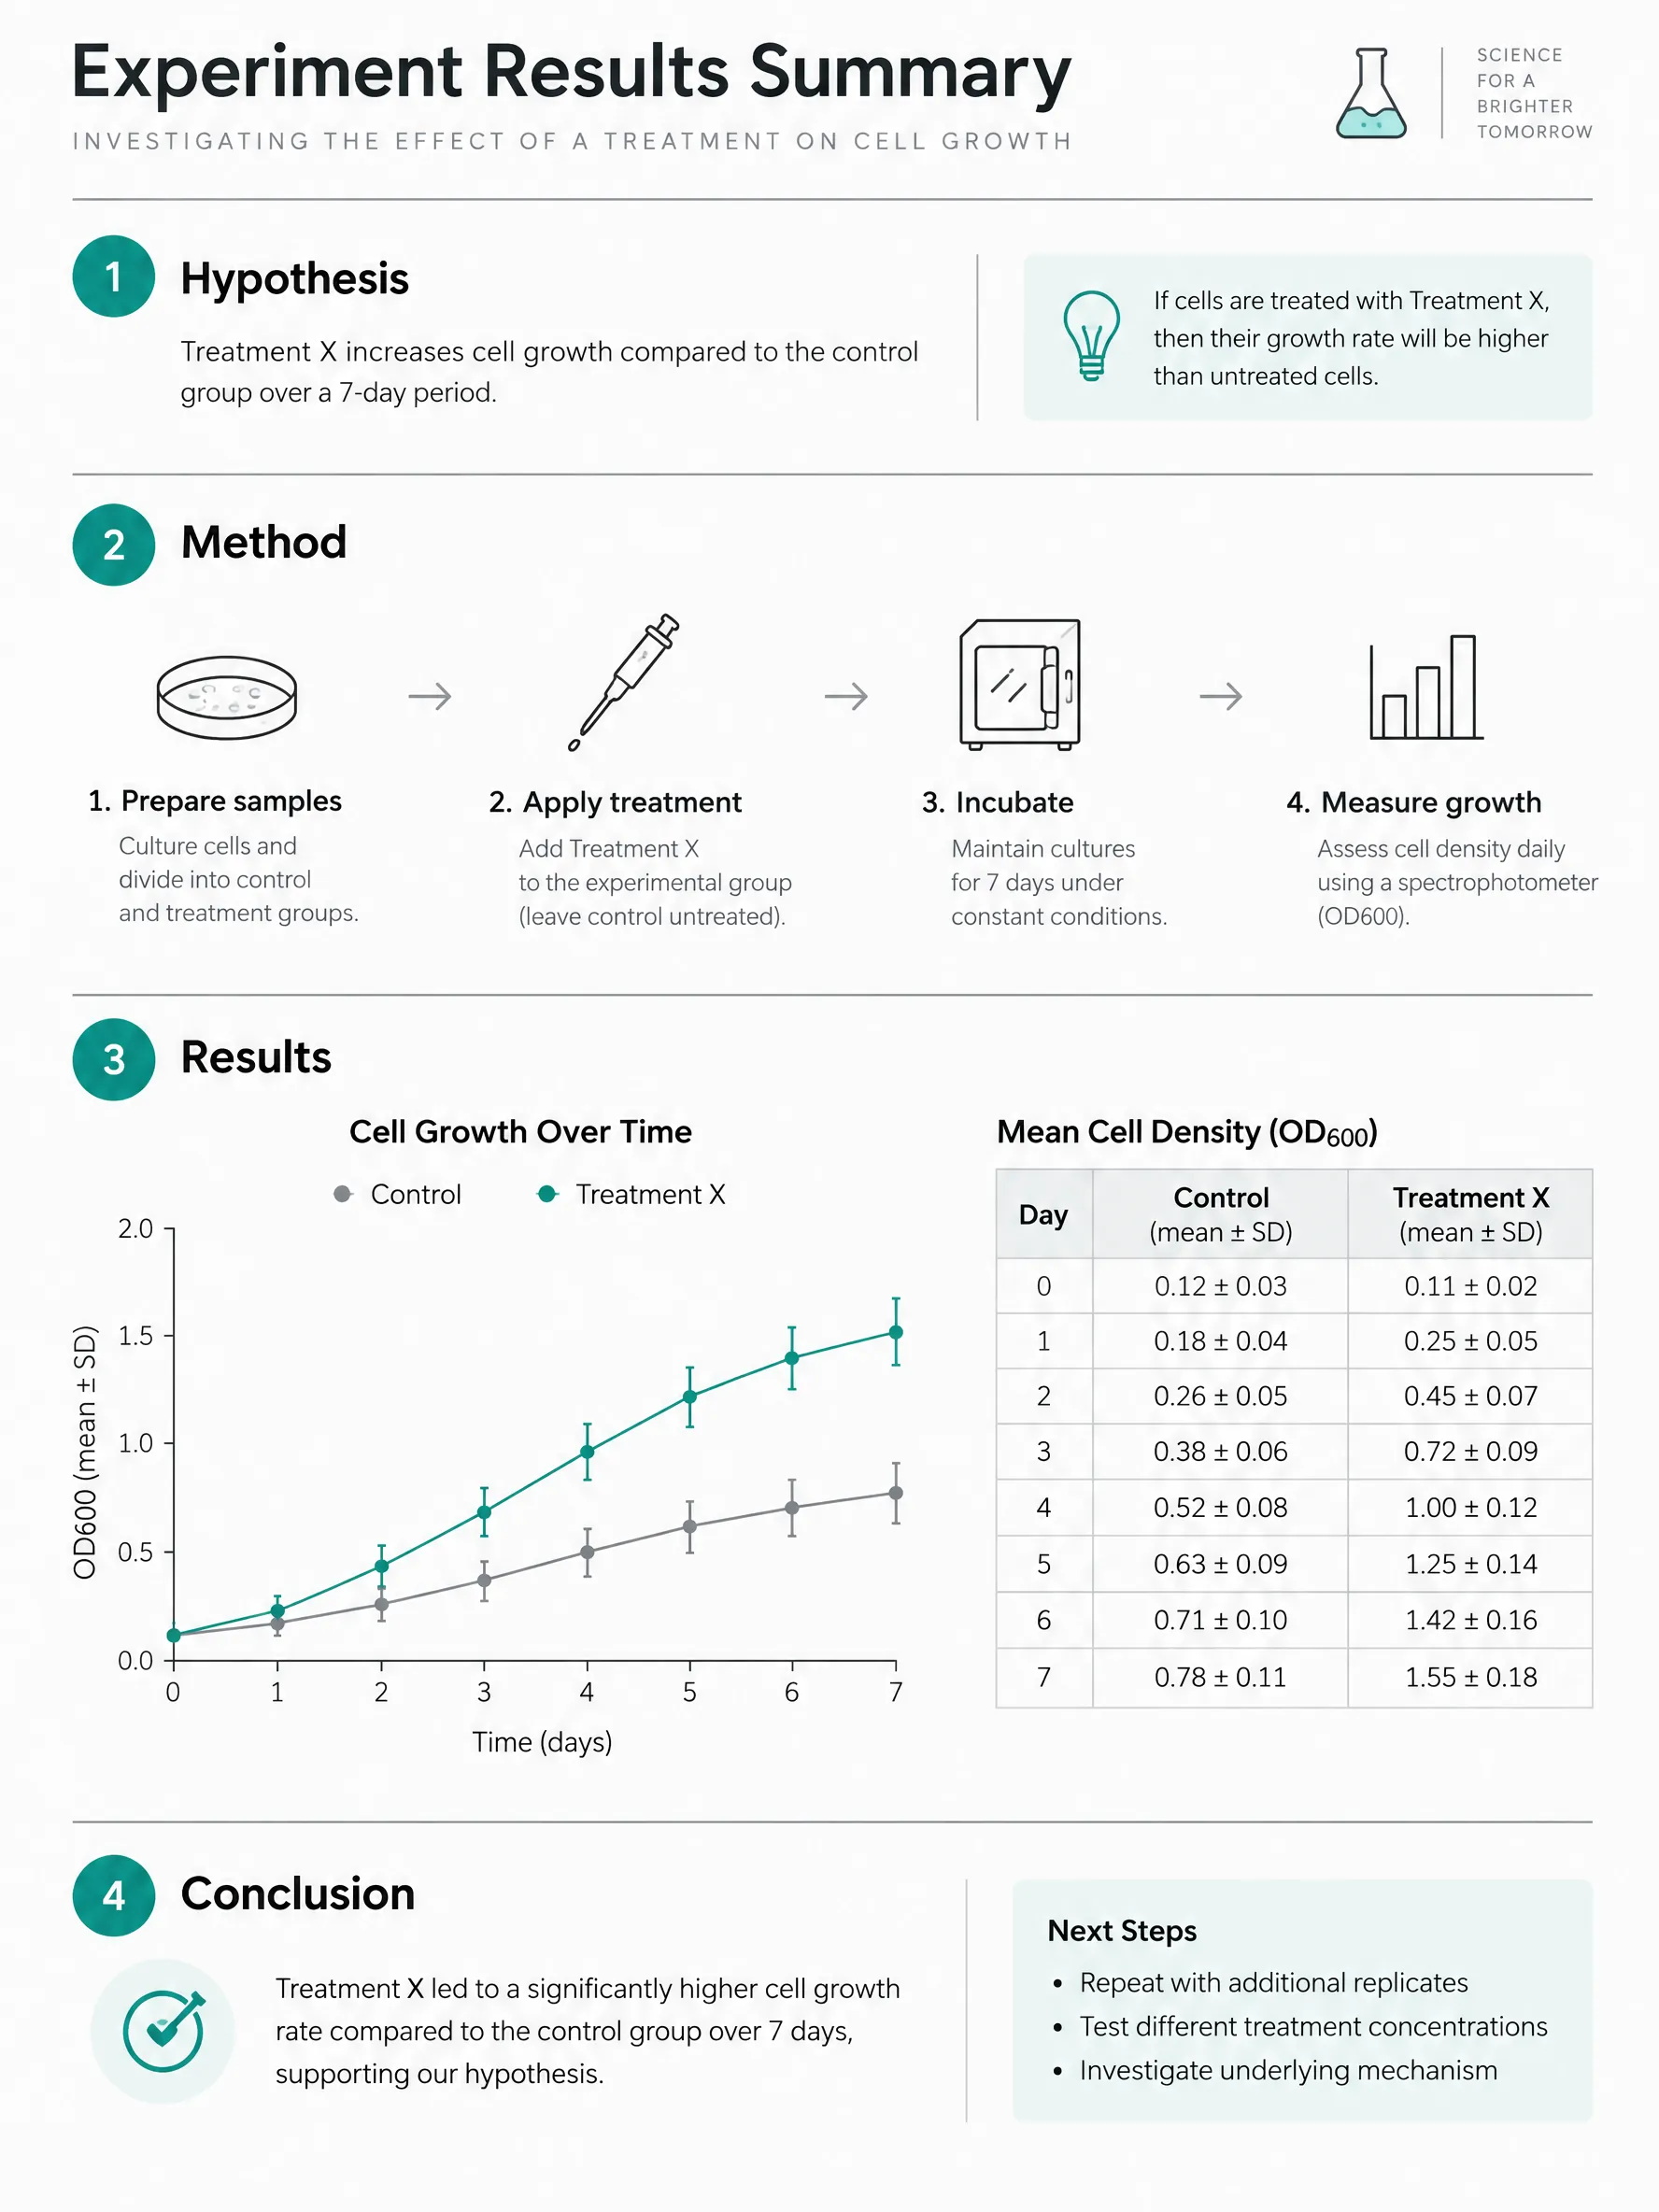
Turn these notes into an infographic. Weekly team update. Wins: launched the new pricing page, closed three enterprise deals. Risks: support backlog is at 48 hours, one engineer is out for two weeks. Next week: clear the backlog, start the onboarding redesign, hold Q4 planning on Thursday.
Open in the generator →Lecture notes · Playful · 2:3
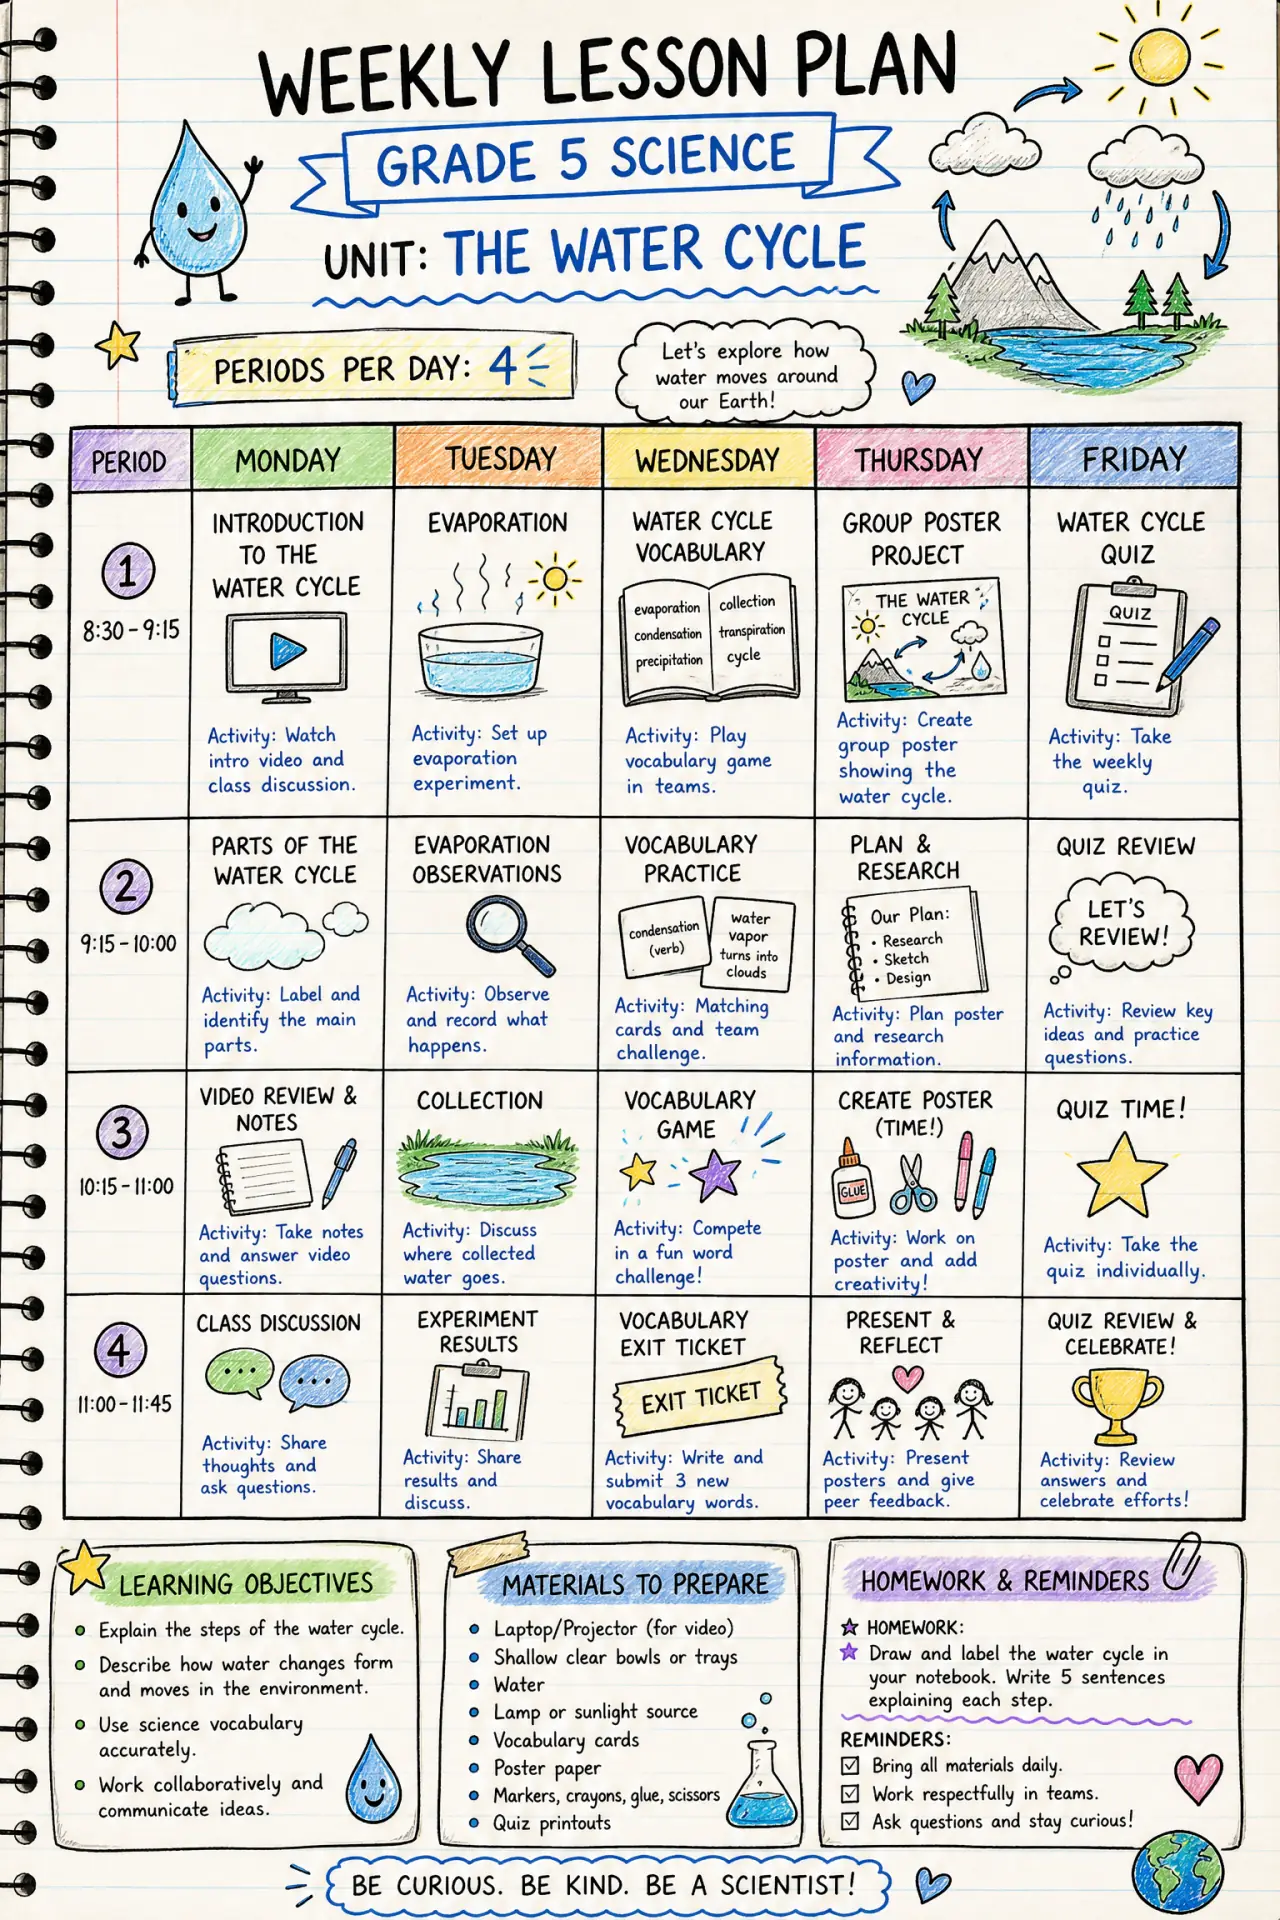
Turn my lecture notes into a one-page summary. Topic: the water cycle. Key terms: evaporation, condensation, precipitation, collection. One sentence on each stage, one everyday example for each, and a short list of three things to remember for the test.
Open in the generator →Project kickoff · Corporate · 2:3
Make an infographic from these kickoff notes. Goal: launch the customer portal by March. Team: product, design, two engineers. Milestones: wireframes in week 2, beta in week 8, launch in week 12. Open questions: single sign-on, data migration, support training.
Open in the generator →
How it works
- 1
Paste your notes
Type or paste a few lines up to a page. Rough bullet points are fine; full sentences are not required.
- 2
Check the style and shape
Minimal in a tall shape is a safe start for notes. Change the style or the shape in the generator if you like.
- 3
Generate, read and download
It takes a minute or two. Check the text, then download the PNG. To adjust anything, edit your notes and generate again.
Related templates
Ready-made starting points that fit this kind of infographic.

Questions
How long can my notes be?
A few thousand characters is accepted, but a page of notes gives the best result. If you have more, split it into topics and make one infographic for each.
Will it keep my wording?
It keeps your points and uses your key terms, but the AI shortens and rephrases to fit the page. If a phrase must appear exactly, put it in quotes in your notes and check it in the result.
Can I edit the infographic afterwards?
There is no editor. Change your notes and generate again, or fine-tune the downloaded PNG in any image editor.
Is my text private?
Your notes are sent to our AI provider to create the image. Avoid pasting confidential information. You get 3 free generations to try it first, with no sign-up.
See the content license and pricing.
Keep reading
Make your first one now
Describe the topic, pick a style and download the result.
Start creatingSecure checkout by Waffo · Cancel any time · Failed generations are refunded