

Comparison Infographic Maker
Put two or three options side by side and get a comparison infographic with matching sections, pros and cons and a short takeaway. Useful for product choices, plans, destinations and study topics.
Starts in the Bold style at 2:3. 2:3 stacks sections neatly for two columns. Use 16:9 or 4:3 when you want three options side by side on a slide.
Making a fair, readable comparison
Use the same rows for every option
Pick the same criteria for each one, such as price, speed and best for. When rows match, the AI lines them up and the reader can scan across.
Stick to two or three options
Two columns are the easiest to read. Three work on a wide shape. Beyond that the page gets crowded; pick the shortlist first.
Give your own facts, then check them
The AI does not look up prices or specs. Write the figures you have confirmed from official sources, and mention the date if they change over time.
Three examples to start from
Each one opens in the generator with the style and shape filled in. Edit the details, then press Generate.
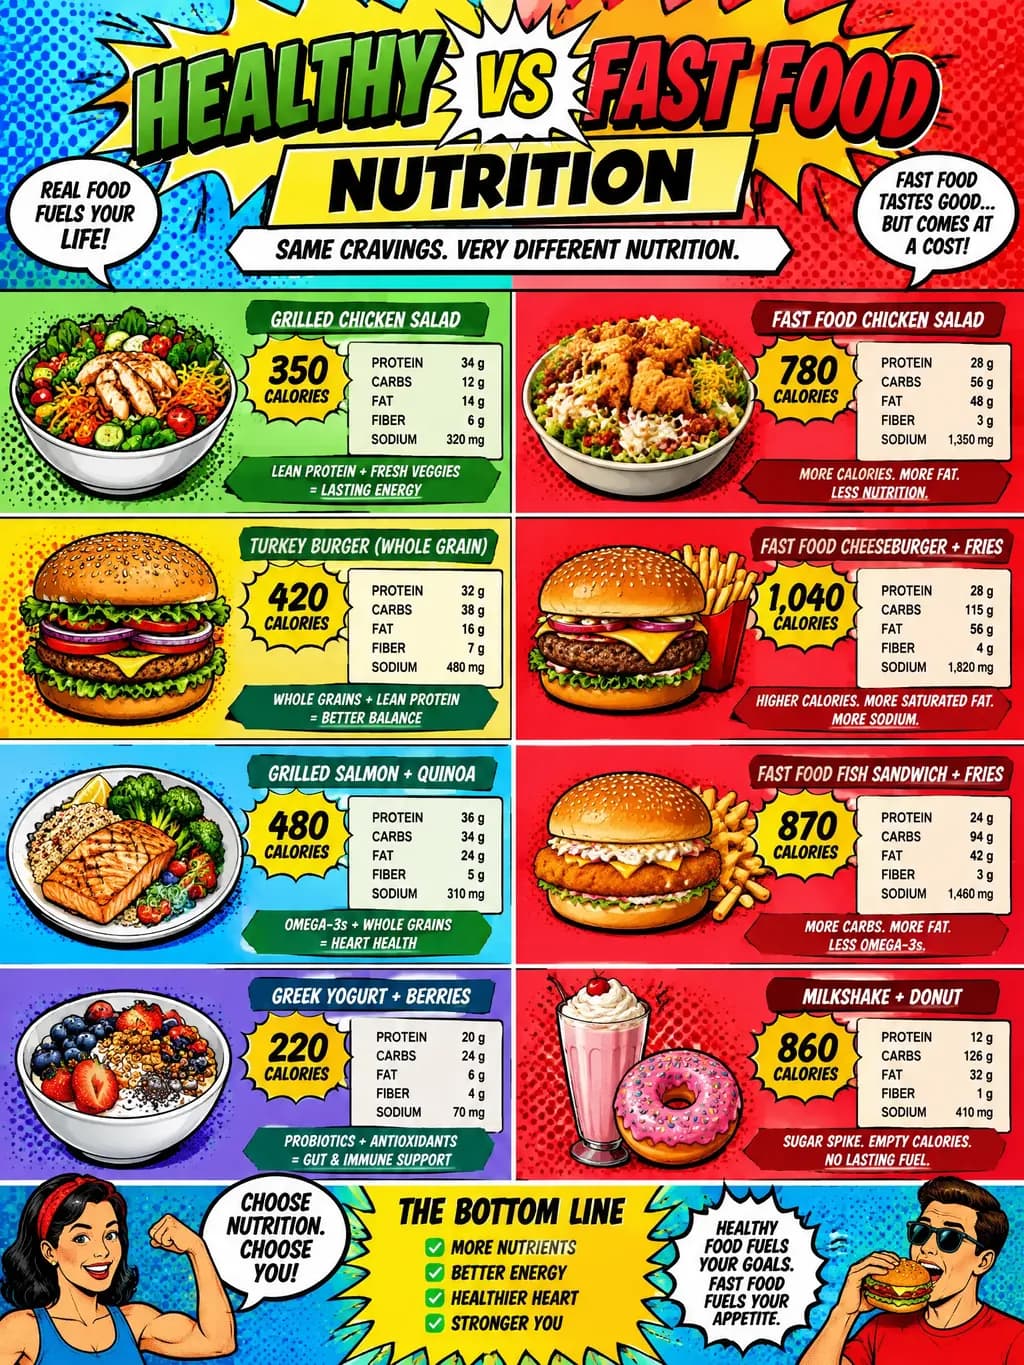
Healthy vs fast food · Pop Art · 2:3
Comparison infographic: a home-cooked grilled chicken bowl versus a typical fast-food burger meal. Compare calories, protein, sodium, cost and prep time, then a short takeaway. Use ranges and say they are approximate.
Open in the generator →Three laptop plans · Minimal · 4:3
Compare three study laptops: Budget, Mid-range and Premium. Rows: price range, battery life, weight, best for. Keep each cell short, and end with a recommendation for each type of student.
Open in the generator →City break: Lisbon vs Prague · Bold · 2:3
Lisbon versus Prague for a 3-day city break: best season, getting around, food highlights, cost level, and who each city suits. Two columns with matching rows and a one-line verdict.
Open in the generator →
How it works
- 1
Name the options and criteria
Say what you compare and the three to six criteria, for example price, battery life, weight, best for.
- 2
Choose two columns or three
Tall 2:3 suits two options; wide 16:9 or 4:3 suits three. Pick a bold or minimal style for clarity.
- 3
Generate and verify
Check each figure against your source. If a row is wrong, correct it in the description and generate again.
Related templates
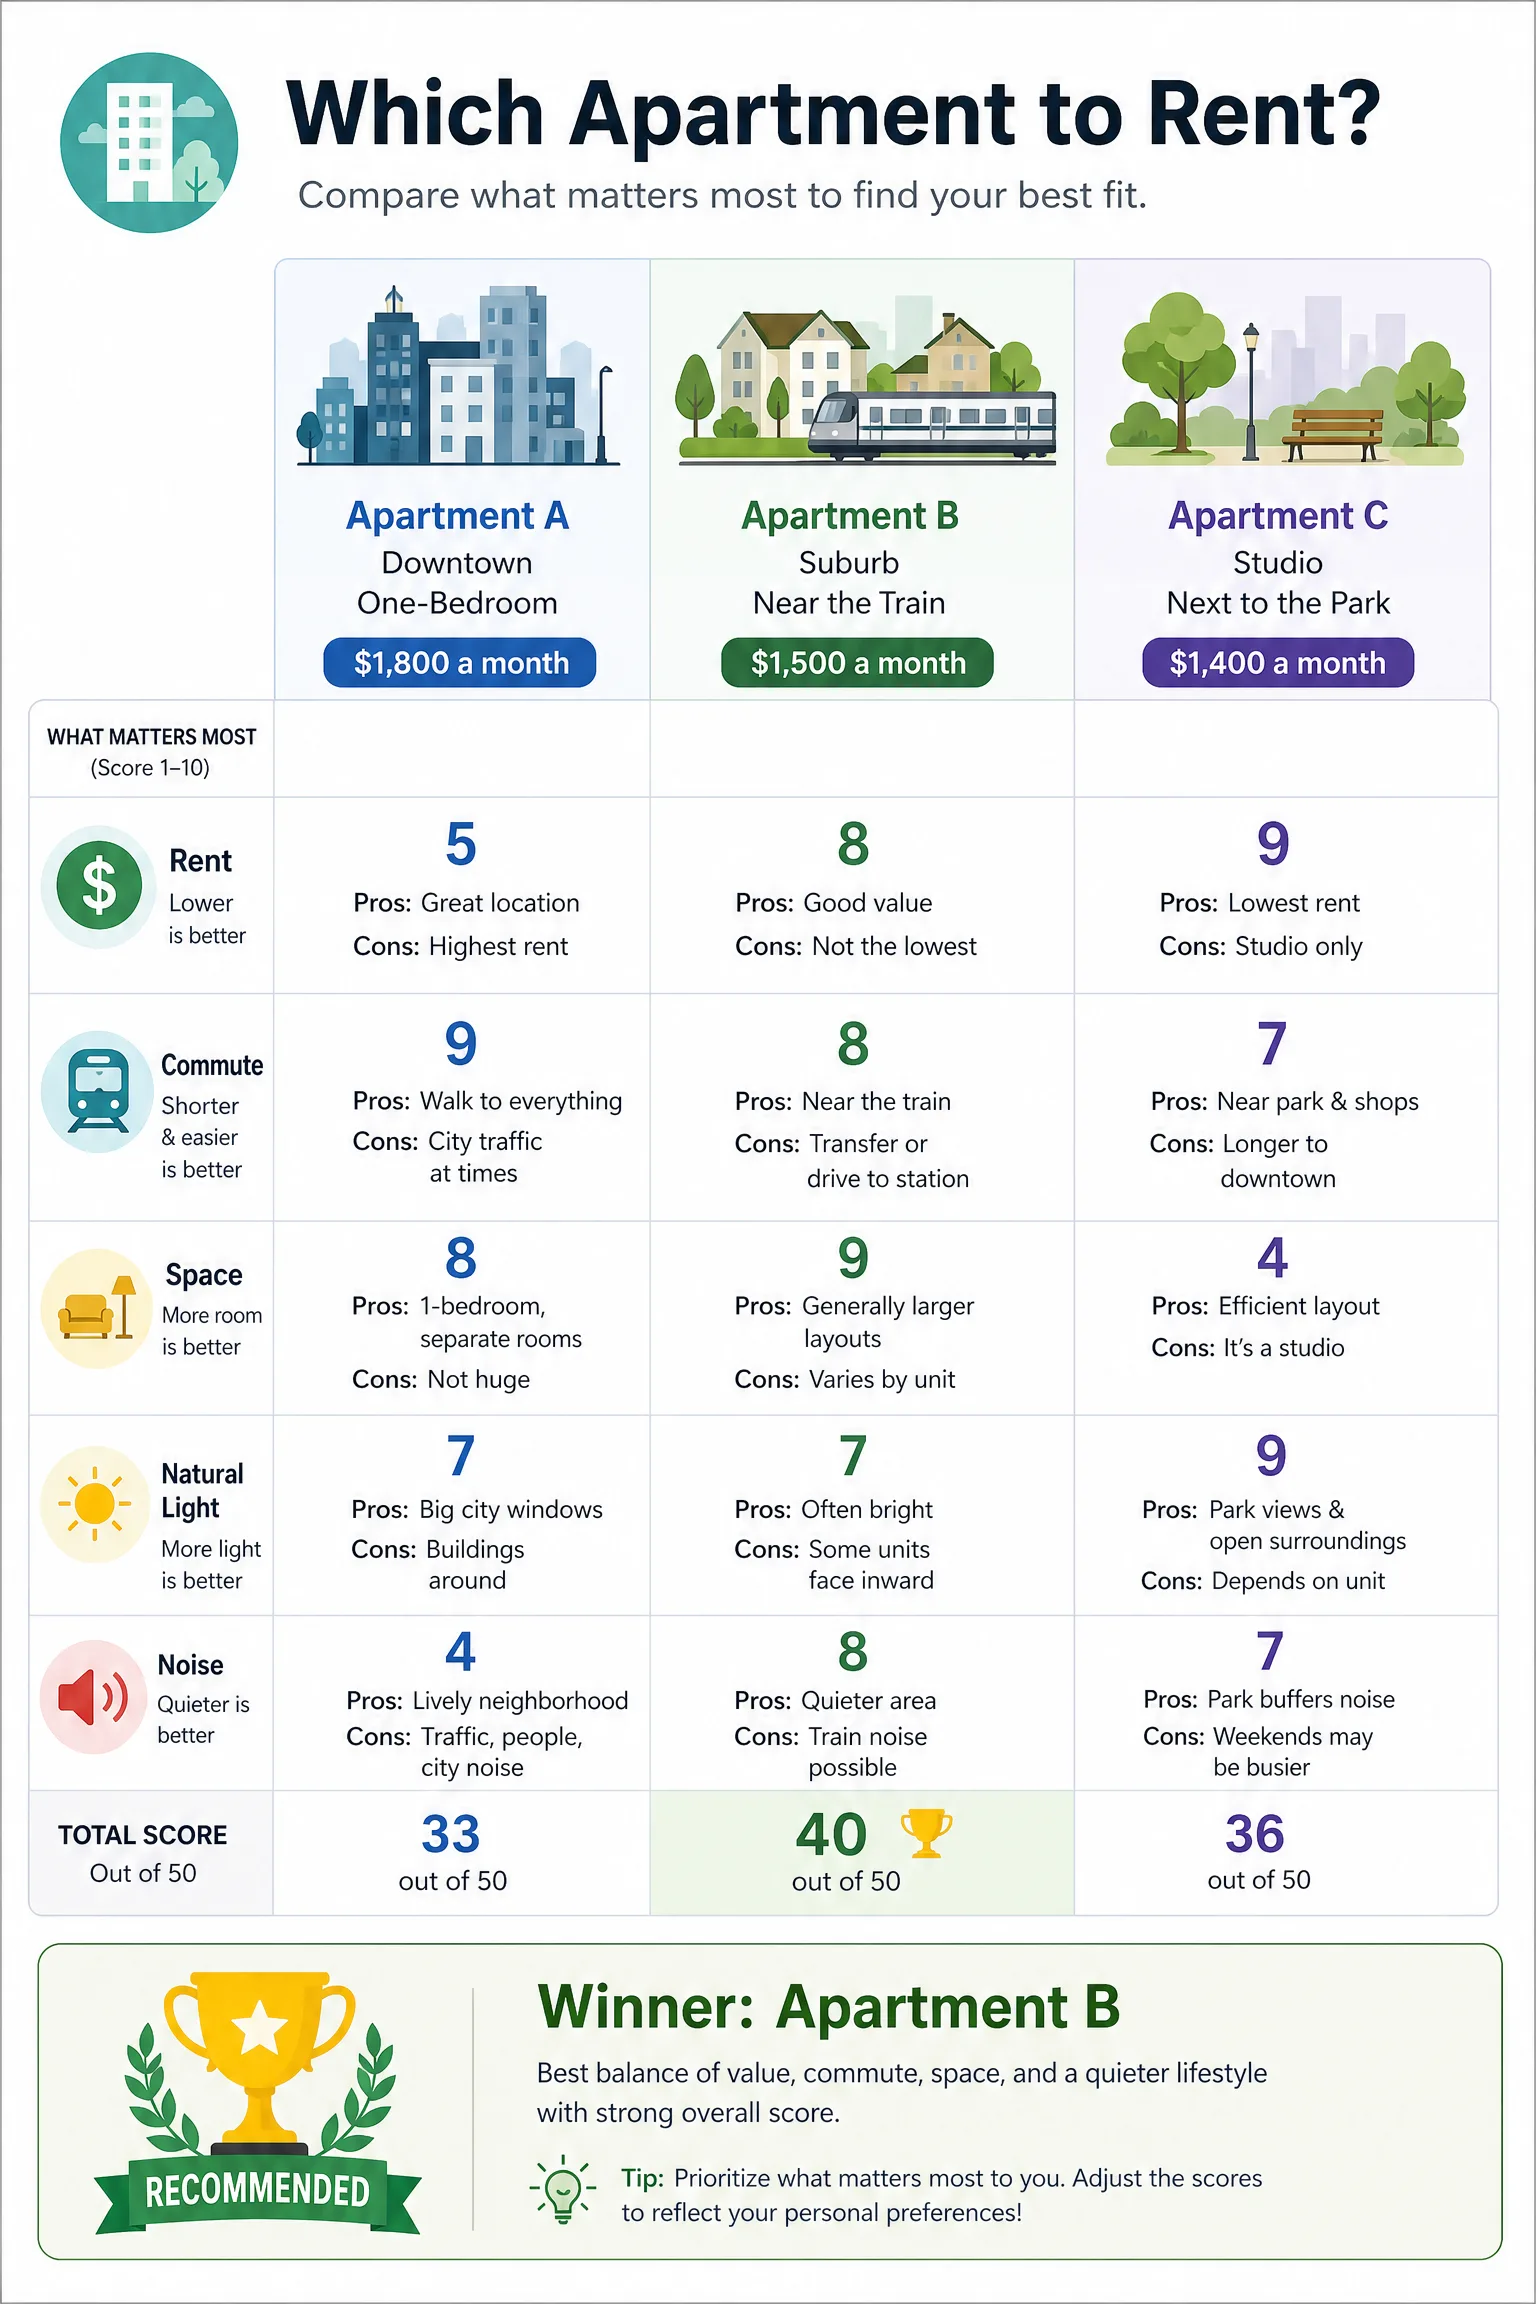
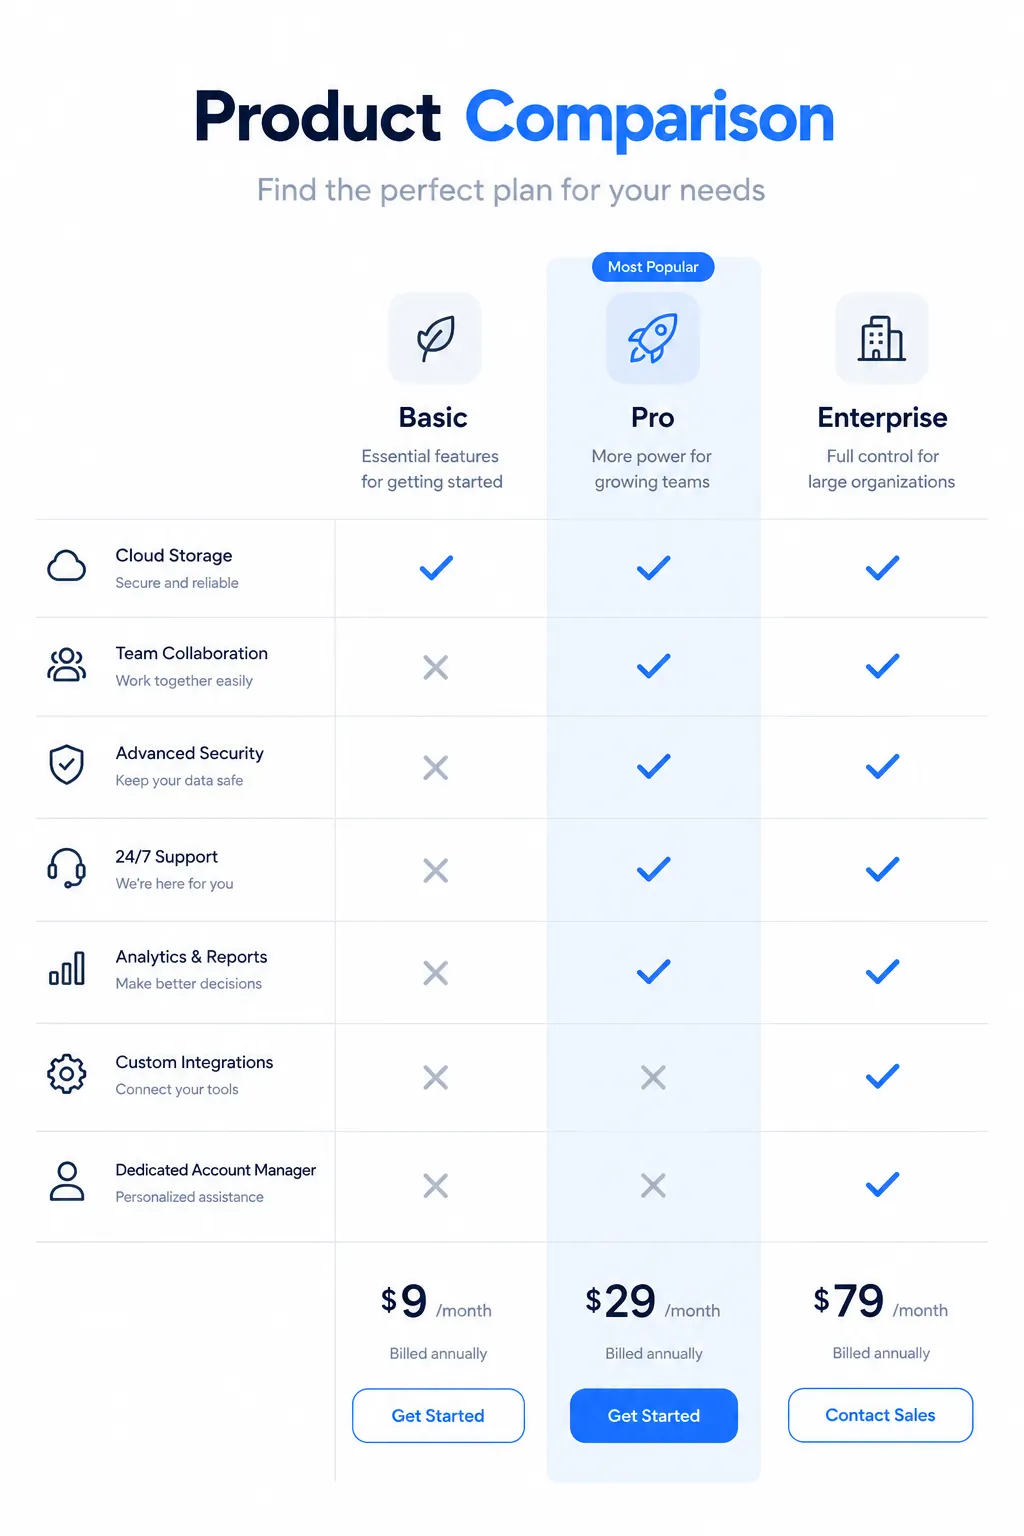
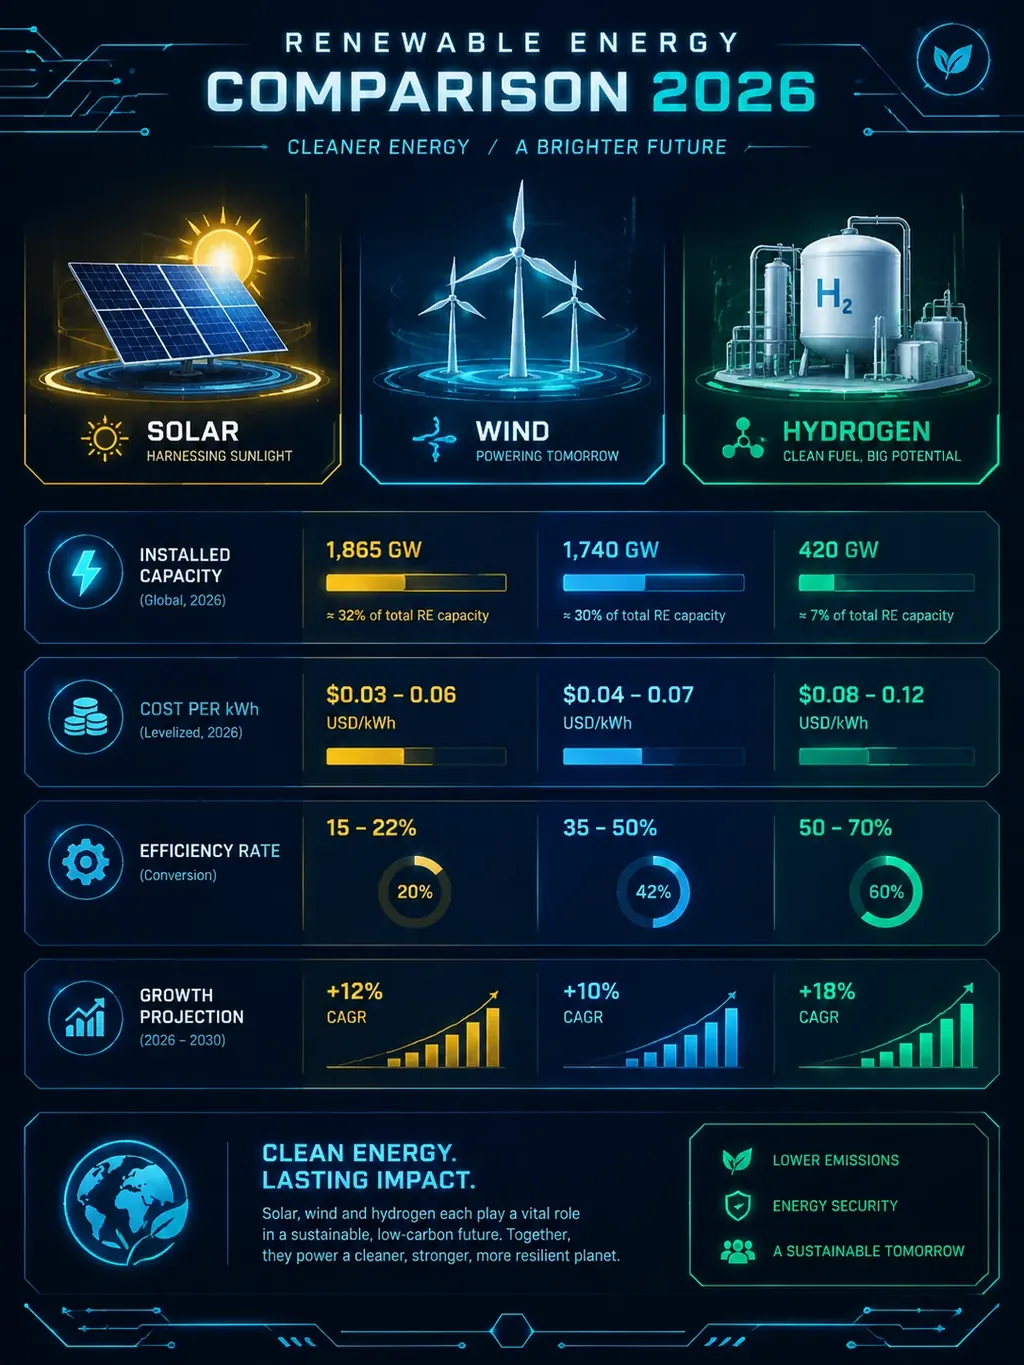
Ready-made starting points that fit this kind of infographic.
Questions
Can it compare three or more options?
Yes. Three options work well on a wide shape such as 16:9 or 4:3. For more than three, narrow the list first so the page stays readable.
Does it look up the prices and features?
No. It draws the figures you supply. Use official pricing pages and spec sheets for the facts, and add an “as of” date if they change.
Can I make a pros and cons infographic?
Yes. Describe one option and ask for pros and cons with icons, or compare two options with matching pros and cons sections.
What is the best style for a comparison?
Bold and Minimal give the clearest columns and contrast. Playful and Pop suit lighter topics. Try two styles with the same description and keep the one you like.
See the content license and pricing.
Keep reading
Make your first one now
Describe the topic, pick a style and download the result.
Start creatingSecure checkout by Waffo · Cancel any time · Failed generations are refunded