


AI/ML Pipeline
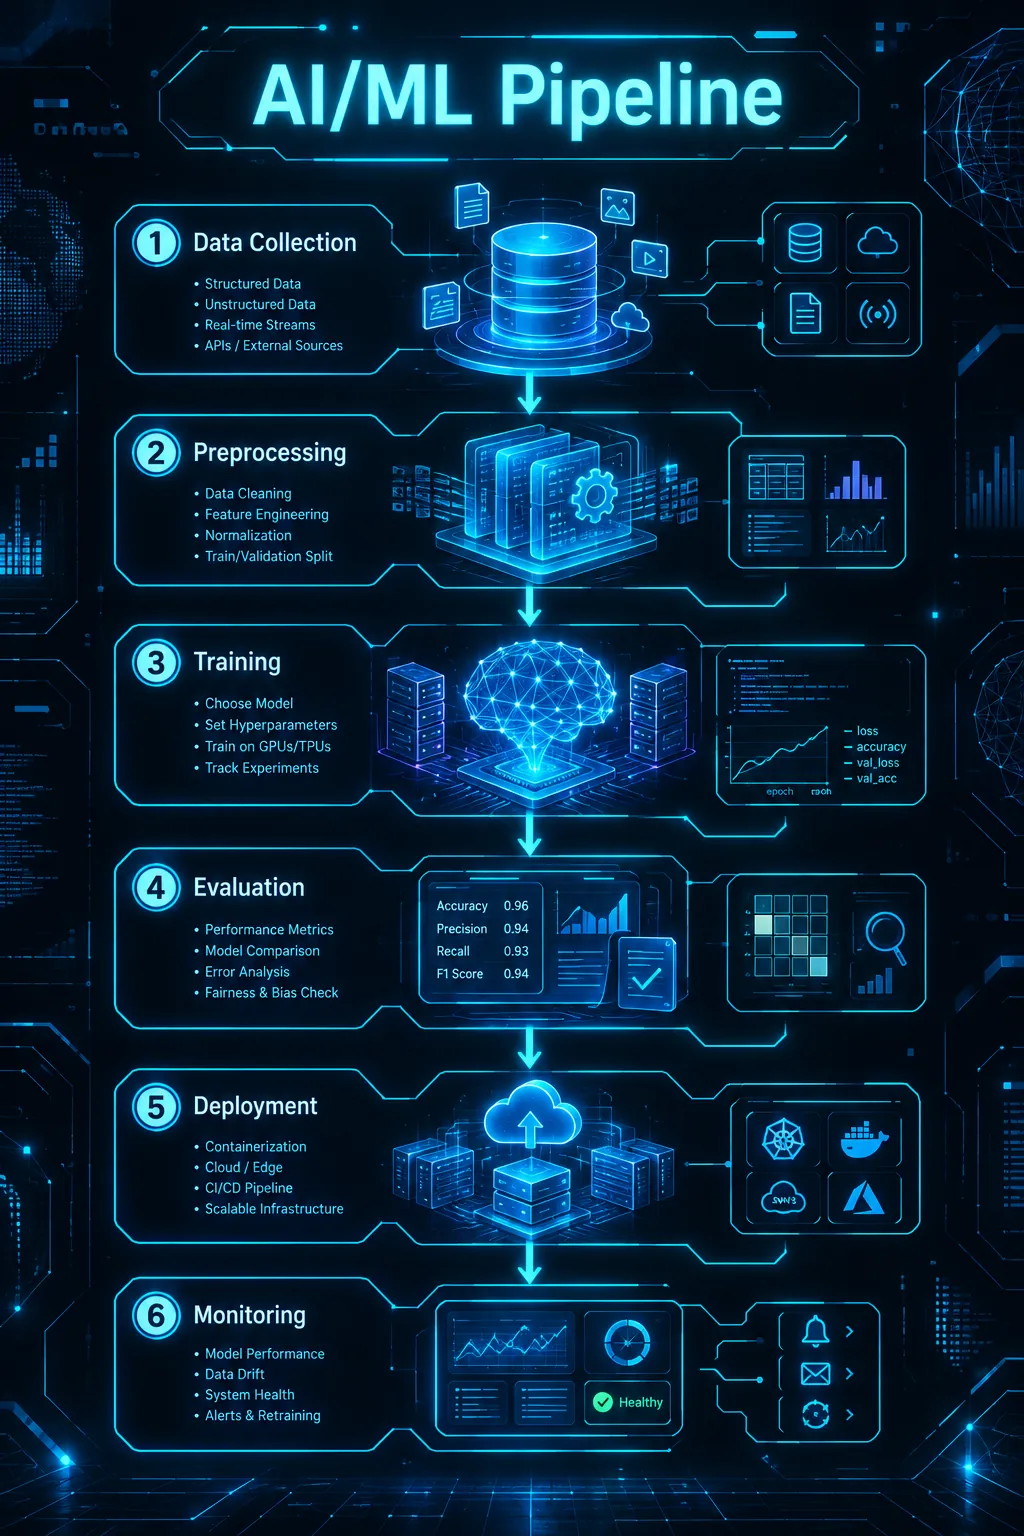
Futuristic data pipeline visualization showing data ingestion, model training, and deployment stages.
Generate this infographic with AI
Pre-filled with the AI/ML Pipeline topic in Tech style — customize and generate in seconds
Use This TemplateWhy Use a AI/ML Pipeline Infographic?
ML pipelines are notoriously difficult to explain to non-technical stakeholders, yet cross-functional buy-in is essential for successful AI projects. This template breaks the pipeline into digestible stages with clear inputs and outputs at each step. The tech style uses futuristic visual language (circuit patterns, glowing nodes) that signals innovation while the structured flow keeps the explanation grounded. Teams use this for engineering documentation, investor pitch decks, and internal training materials — any context where 'how does our AI actually work?' needs a clear, visual answer.
Best Practices for AI/ML Pipeline Infographics
Key Metrics to Include
Make your ai/ml pipeline infographic data-driven by including these essential metrics:
About the Tech Style

Tech — Futuristic, data visualization
Glowing cyan circuit lines on dark backgrounds with holographic overlays. Built for AI, cybersecurity, blockchain, and technology topics. Conveys innovation and cutting-edge thinking.
Browse all Tech templatesHow to Create Your AI/ML Pipeline Infographic
Click Use This Template
The AI generator opens with the "AI/ML Pipeline" topic and Tech style already selected. The prompt includes relevant data points like data volume and feature count and training time and compute cost.
Add Your Own Data
Replace the sample data points with your actual numbers. Show the ML pipeline as a loop, not a linear flow.
Generate & Download
Hit Generate and your infographic is ready in seconds. Download the high-resolution image for social media, presentations, or your website.
Ready to Create Your AI/ML Pipeline Infographic?
No design skills needed. Just customize the topic and let AI do the rest.
Use This Template — FreeRelated Templates

Cybersecurity Framework
Tech style · Technology
Threat landscape overview with attack vectors, defense layers, and best practices for IT security.
Renewable Energy Source Comparison
Tech style · Science
Futuristic data visualization comparing solar, wind, hydropower, and hydrogen energy sources across cost, efficiency, scalability, and environmental metrics. Ideal for energy sector reports and sustainability presentations.

Gaming Industry Stats
Dark style · Technology
Neon-accented gaming industry overview. Market size, player demographics, and platform breakdowns.

SaaS Product Features
Glass style · Technology
Modern frosted-glass UI showcase. Feature highlights, integrations, and pricing for SaaS products.