

10 Best Infographic Examples That Drive Engagement in 2026
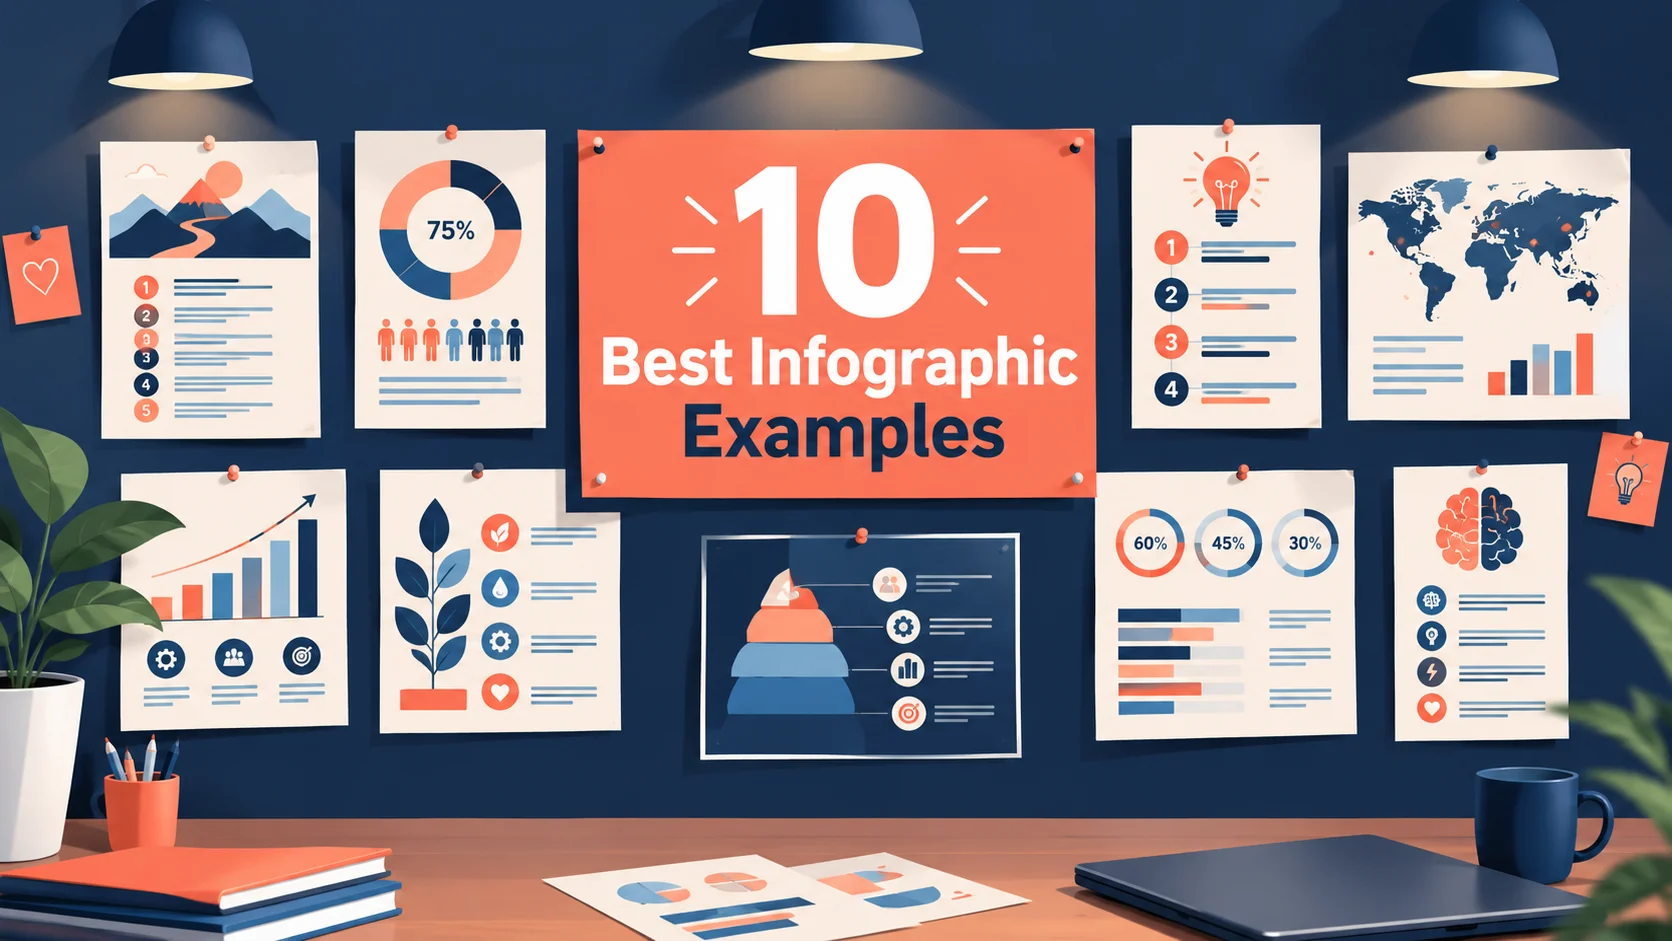
What Makes an Infographic Go Viral?
Not all infographics are created equal. The ones that drive real engagement share common traits: they present surprising data, use a clear visual hierarchy, and deliver immediate value to the viewer. In 2026, with attention spans shorter than ever, the best infographic examples prove that you have roughly three seconds to hook someone before they scroll past.
This guide breaks down ten standout examples across industries, explaining why each one works and how you can apply the same principles to your own content strategy — whether you design manually or use an AI infographic generator.
1. Data-Driven Trend Reports
Infographics that compile industry statistics into a single visual consistently outperform other content formats on LinkedIn and Twitter. A well-designed trend report — like an AI trends overview for 2026 — combines bar charts, iconography, and concise annotations to make dense data approachable. Lead with the most surprising statistic in large type.
2. Step-by-Step Process Guides
Process infographics break complex workflows into numbered steps with supporting icons. They excel in educational content, onboarding materials, and how-to blog posts. The machine learning workflow format shows a technical pipeline understandable at a glance. People save process infographics as reference material, generating long-tail engagement. Limit yourself to five to seven steps for best results.
3. Comparison Charts
Side-by-side comparisons help audiences make decisions quickly. Use consistent scales and color coding, and highlight the recommended option subtly rather than making the design feel like an advertisement.
4. Timeline Infographics
Timelines transform chronological data into a visual journey. An infographic covering space exploration milestones demonstrates how timelines make decades of progress feel immediate. Mark major milestones with larger nodes and brief descriptions.
5. Statistical Snapshots
Single-topic statistical infographics — like mental health awareness data — present a curated set of numbers around one theme. They are ideal for awareness campaigns, report summaries, and social media posts. Each statistic acts as a standalone shareable moment. Design each data point as its own visual module so the infographic remains effective when cropped for social media.
6. Geographic Data Maps
Map-based infographics visualize regional differences in economic indicators, demographic trends, or environmental metrics. Always include a color scale legend and cite the data year prominently.
7. Listicle Infographics
Numbered lists remain one of the most shared content formats online. When combined with icons and brief descriptions, listicle infographics deliver scannable value that readers bookmark and return to. Use custom icons for each item rather than generic bullet points to increase visual retention.
8. Before-and-After Visualizations
Transformation stories are inherently compelling. Before-and-after infographics show change over time using split layouts or slider-style designs. Quantify the change wherever possible — "40% improvement" is more compelling than "significant improvement."
9. Social Media Strategy Overviews
Marketing teams rely on infographics to communicate strategy across stakeholders. A visual breakdown of platform demographics and posting schedules — similar to a social media marketing strategy infographic — aligns teams faster than any slide deck.
10. Interactive and Animated Infographics
Animated versions featuring progressive data reveals or scrolling narratives generate higher engagement on web pages and email campaigns. Start with a strong static version, then add animation selectively.
How to Evaluate Any Infographic Example
Seeing an infographic that performs well is useful only if you can explain why it works. Use these five questions to evaluate any example, including your own drafts:
- Can you state the message in one sentence? If a viewer cannot summarize the point after ten seconds, the design is carrying too many ideas.
- Is the data credible and visible? Strong examples cite their sources and dates directly on the graphic, which builds trust and makes the piece easier to reference.
- Does the hierarchy guide the eye? The largest element should be the most important one, with supporting details stepping down in size and contrast.
- Does it survive cropping? Social platforms crop images unpredictably. Modular designs, where each section stands on its own, keep their value when shared in pieces.
- Would someone save or share it? The best examples offer a reason to bookmark them: a checklist, a benchmark, or a surprising comparison people want to show to colleagues.
Scoring a few of your favorite infographics against these questions trains your eye faster than reading any number of design articles.
Choosing the Right Format for Your Goal
Every format above solves a different communication problem. Matching the format to your goal is often the single biggest factor in whether an infographic succeeds.
- Raise awareness: Use a statistical snapshot or a listicle. Both put a handful of memorable numbers or ideas front and center and are easy to share.
- Teach a skill or workflow: Use a step-by-step process guide. Numbered stages and simple icons make it easy to follow and to save for later reference.
- Help someone decide: Use a comparison chart with consistent scales so differences are obvious at a glance.
- Tell a story over time: Use a timeline or before-and-after layout to show how things changed and why it matters.
- Explain regional differences: Use a geographic map with a clear legend and a prominent data year.
If you are unsure, start from the question your audience is asking. People searching for "how does this work" want a process; people asking "which one should I choose" want a comparison.
Patterns Behind High-Performing Infographics
Look across the examples in this guide and the same habits keep appearing. A headline that promises a specific benefit gets the first click. One hero statistic, set noticeably larger than everything else, gives the eye an entry point. Consistent iconography and a limited palette make dense information feel organized rather than busy, and a visible source line signals that the numbers can be trusted.
Strong examples are also designed for the places they will actually be seen. A tall layout works well on Pinterest and in blog posts, while a square or four-by-five crop fits Instagram and LinkedIn feeds. Planning those crops from the start is far easier than trying to rescue a design afterward.
Build Your Own Infographic Swipe File
Professional designers and content teams keep a swipe file: a folder of examples they admire, organized so they can find inspiration quickly. Creating one takes only a few minutes a week.
- Collect. Save screenshots or links whenever an infographic catches your attention, along with where you found it.
- Tag. Label each example by format (timeline, comparison, process), topic, and the platform where it performed well.
- Annotate. Write one sentence about what works, such as "oversized hero statistic" or "clear color coding by category."
- Review. Before starting a new project, spend five minutes scanning examples of the same format and borrow the structural ideas, not the visuals themselves.
Over a few months, the swipe file becomes a personal playbook that speeds up planning and keeps your work consistent without copying anyone else's design.
How Different Industries Put These Formats to Work
The same formats appear across sectors, but each field leans on them in its own way. Looking at industry habits helps you pick a starting point that audiences already understand.
- Finance: Comparison charts for rates and fees, step-by-step guides to budgeting or investing, and statistical snapshots that make market data approachable.
- Healthcare: Checklists, symptom guides, and process diagrams that turn clinical information into plain language patients can act on.
- Technology and SaaS: Architecture overviews, feature comparisons, and security checklists that help non-technical buyers understand what a product does.
- Education: Timelines, study guides, and concept maps that students save and revisit before exams or projects.
- E-commerce and retail: Size guides, care instructions, and buyer's-guide comparisons that reduce uncertainty at the point of purchase.
- Sustainability and science: Data-driven snapshots and before-and-after visuals that make slow, large-scale change feel concrete.
Whatever your field, borrow the structure that suits your audience's most common question, then fill it with your own data and voice.
Quick Wins for Improving an Existing Infographic
You do not always need to start from scratch. If an infographic is underperforming, a handful of small changes can make a noticeable difference:
- Enlarge the most important statistic and move it into the top third of the layout.
- Rewrite the headline so it promises a specific benefit or answers a specific question.
- Remove one low-value section to give the remaining content more room.
- Add a visible source line and publication year beneath the data.
- Export a square or four-by-five crop of the best section for social sharing.
Test one change at a time when you can, and note which adjustments move shares, saves, or clicks. Those small lessons are what turn a collection of examples into a repeatable process.
Apply These Patterns to Your Content
The best infographic examples share a commitment to clarity, credible data, and audience-centric design. Study the formats that resonate in your industry, then adapt them to your unique data and brand voice.
With AI tools accelerating production, the bottleneck is no longer design skill — it is knowing which format fits your message. Browse our infographic gallery for more inspiration, or create your own infographic using any of these proven formats in minutes.
Keep reading: See where these formats are heading in infographic design trends and best practices for 2026.
Create Your Own Infographic
Apply what you learned and generate a professional infographic with AI in seconds.
Start Creating — FreeRelated Articles
How to Create an Infographic: A Complete Step-by-Step Guide
Learn how to create a professional infographic from scratch. A step-by-step guide covering research, structure, design, and publishing.
GuidesHow to Use AI to Make Infographics in 2026
A practical guide to using AI infographic makers in 2026. Learn prompting techniques, workflow tips, and how to get professional results fast.
GuidesAI Data Infographics for Business Presentations: A Practical Guide
Use AI infographic generators to create data-driven visuals for board meetings, investor decks, and client presentations in minutes.