

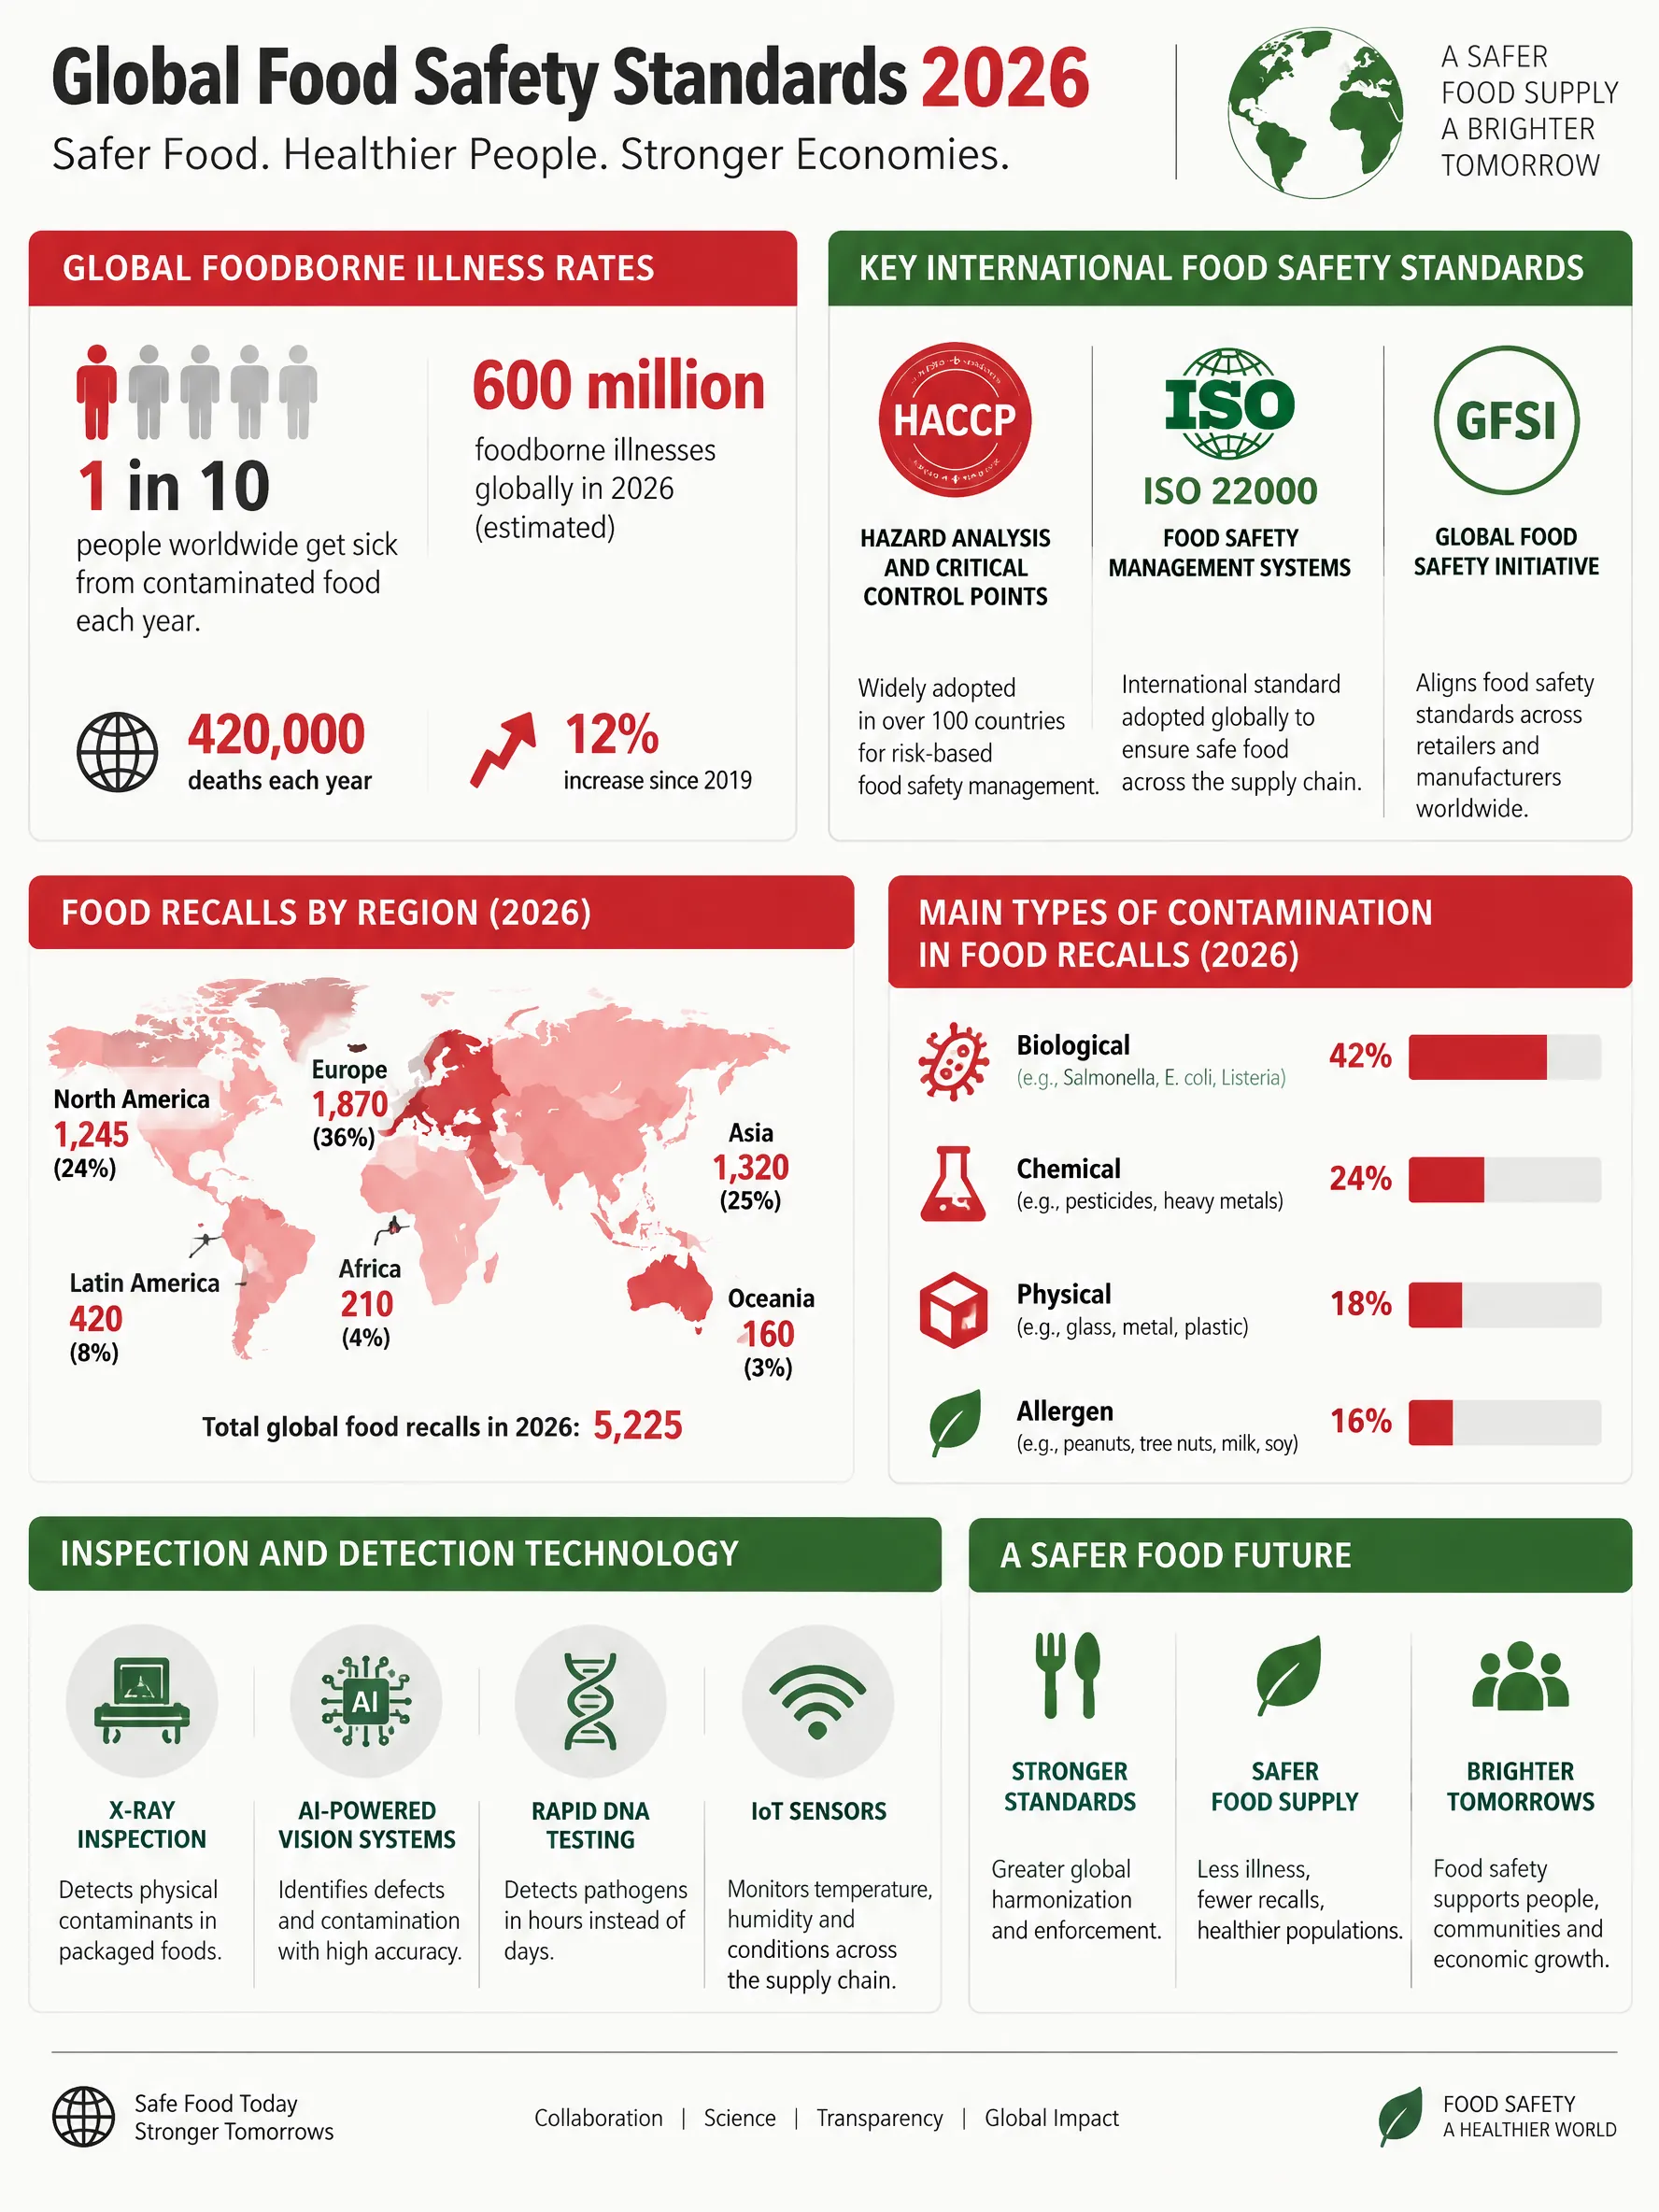
Global Food Safety Standards Overview 2026 Infographic
Food safety statistics worldwide: foodborne illness rates, international certifications, recall data, contamination types, inspection technology, and regulatory framework comparison.
Published
Generate a custom version of this infographic
Customize with your own data, style, and branding
Generate This InfographicKey Statistics
- 1Unsafe food causes 600 million illnesses and 420,000 deaths annually worldwide (WHO, 2025)
- 2Children under 5 account for 30% of foodborne disease deaths despite being 9% of population (WHO, 2025)
- 3ISO 22000 food safety certification covers 36,000+ organizations globally (ISO Survey, 2026)
- 4US FDA recorded 2,850 food recalls in 2025; undeclared allergens cause 40% of all recalls (FDA, 2026)
- 5Blockchain traceability traces products from farm to shelf in 2.2 seconds vs 7 days traditional (Walmart/IBM, 2025)
- 6IoT cold chain monitoring reduces temperature excursion incidents from 30% to under 5% (Cold Chain Federation, 2026)
- 7Norovirus is the leading cause of foodborne illness globally with 685 million annual cases (CDC/WHO, 2025)
About Global Food Safety Standards Overview 2026
Food safety remains one of the most critical public health challenges globally, affecting every nation regardless of economic development. The World Health Organization estimates that unsafe food causes 600 million cases of foodborne illness and 420,000 deaths annually — a burden that disproportionately impacts children under five, who account for 30% of foodborne disease deaths despite comprising only 9% of the global population. In 2026, the intersection of technology, regulation, and consumer demand is driving significant transformation in how the world ensures food safety.
The global food safety landscape is governed by overlapping international and national frameworks. The Codex Alimentarius Commission (established by FAO and WHO) sets international food standards adopted by 189 member countries. HACCP (Hazard Analysis Critical Control Points) is the universal food safety management system, required by law in the EU, US, Canada, Japan, and Australia. ISO 22000 provides a certifiable food safety management system standard, with over 36,000 certified organizations worldwide in 2026. The Global Food Safety Initiative (GFSI) benchmarks certification schemes including SQF, BRC, FSSC 22000, and IFS — collectively covering an estimated 65% of global food trade by value.
Foodborne contamination falls into three main categories. Biological hazards (bacteria, viruses, parasites) cause 90% of foodborne illness: Salmonella accounts for 78 million cases globally, Campylobacter 96 million, Norovirus 685 million, and E. coli (STEC) 2.8 million. Chemical hazards include pesticide residues (detected in 45% of produce samples globally, though 97% within legal limits), heavy metals (arsenic in rice, mercury in seafood, lead in spices), food additives exceeding safe levels, and processing contaminants (acrylamide, PAHs). Physical hazards — glass, metal, plastic, stones — trigger 25% of food recalls in developed countries.
Food recall data reveals systemic patterns. The US FDA recorded 2,850 food recalls in 2025 — a 15% increase from 2020, partially reflecting improved detection. Undeclared allergens cause 40% of recalls (with milk, tree nuts, and soy most common), followed by pathogen contamination (30%, predominantly Listeria and Salmonella), foreign objects (15%), and mislabeling (10%). The EU's Rapid Alert System for Food and Feed (RASFF) processed 4,100 notifications in 2025. Average recall costs for manufacturers range from $10 million for a standard recall to $100 million+ for major incidents, excluding long-term brand damage.
Technology is revolutionizing food safety monitoring. Blockchain-based traceability (adopted by Walmart, Nestlé, Carrefour, and others) can trace a product from farm to shelf in 2.2 seconds versus 7 days with paper-based systems. AI-powered visual inspection systems detect defects with 99.5% accuracy at processing speeds of 1,200 items per minute. IoT sensors monitor cold chain compliance in real time — an estimated 30% of temperature-sensitive food shipments experience cold chain breaks, with IoT reducing this to under 5% in equipped fleets. Rapid pathogen testing (PCR-based methods) delivers results in 4-8 hours versus 2-5 days for traditional culture methods, and CRISPR-based detection systems under development promise 30-minute field tests. Whole genome sequencing has transformed outbreak investigation, enabling authorities to link cases across geography and time with genetic precision.
Frequently Asked Questions
What are the most common causes of foodborne illness?
What food safety certifications should consumers look for?
How is technology improving food safety?
Sources
- World Health Organization, Food Safety Fact Sheet, 2025
- US Food and Drug Administration (FDA), Annual Recall Data, 2026
- ISO, ISO Survey of Management System Standard Certifications, 2026
- Cold Chain Federation, Temperature Monitoring Technology Report, 2026
- RASFF, Annual Report on the Rapid Alert System for Food and Feed, 2025
Source links go to each publisher's official website.
Embed This Infographic
Copy the code below to share this infographic on your website
<a href="https://www.makeinfographics.ai/infographic/global-food-safety-standards-statistics-2026" target="_blank" rel="noopener">
  <img src="https://www.makeinfographics.ai/images/infographics/food-safety-standards.webp"
       alt="Global Food Safety Standards Overview 2026 — Food safety statistics worldwide: foodborne illness rates, international certifications, recall data"
       width="960" height="1280" loading="lazy"
       style="max-width:100%;height:auto;" />
</a>
<p>Source: <a href="https://www.makeinfographics.ai">MakeInfographics.ai</a> — Free AI Infographic Generator</p>
Create Your Own Global Food Safety Standards Overview 2026 Infographic
Customize this topic with your own data, style, and branding
Create Custom Version — FreeRelated Infographics
All Food & Cuisine infographics →Coffee Production Worldwide
Global coffee industry: Brazil and Vietnam lead production, 2.25 billion cups consumed daily, fair trade impact, and bean-to-cup supply chain.
World's Most Popular Cuisines Ranked
A visual ranking of the world's most popular cuisines based on global surveys — from Italian and Japanese to Mexican and Thai. Explore flavor profiles, signature dishes, and culinary influence by region.
World Street Food Guide by Country
A culinary journey through the world's best street food destinations, featuring iconic dishes, average prices, food safety ratings, and the cultural significance of street food globally.
Plant-Based Food Market Statistics 2026
Comprehensive overview of the $78 billion plant-based food market including meat alternatives, dairy substitutes, consumer demographics, nutritional data, and environmental impact.