

Coffee Production Worldwide Infographic
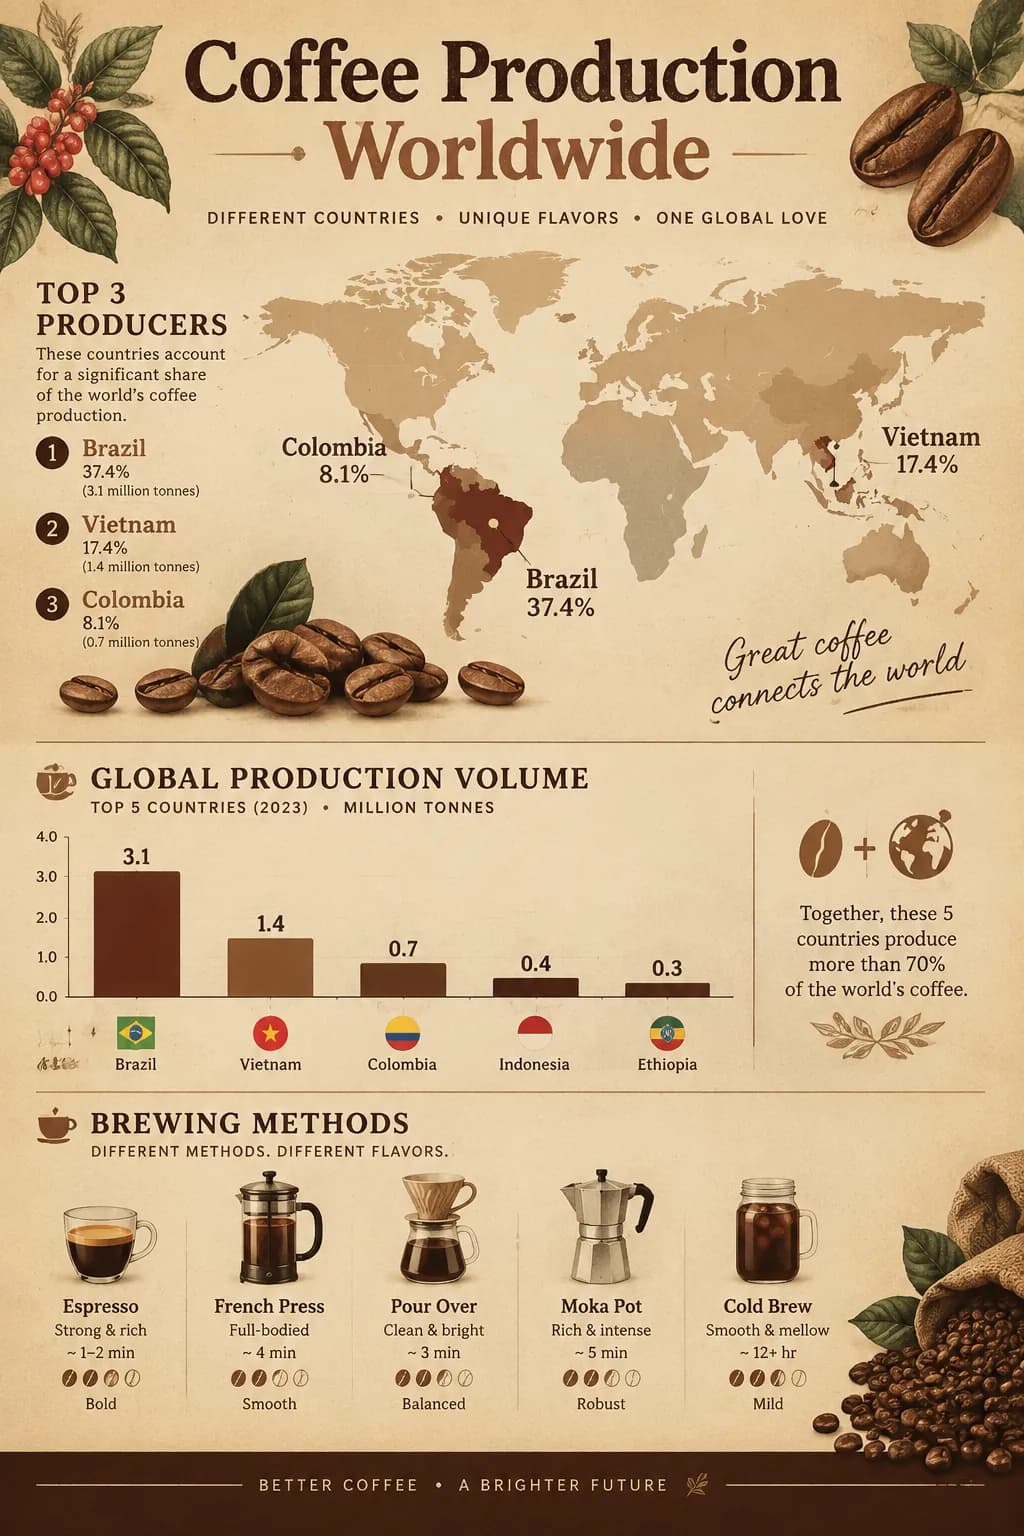
Global coffee industry: Brazil and Vietnam lead production, 2.25 billion cups consumed daily, fair trade impact, and bean-to-cup supply chain.
Published · Updated
Generate a custom version of this infographic
Customize with your own data, style, and branding
Generate This InfographicKey Comparisons
Comparing Coffee Production Worldwide
Coffee is one of the world's most traded agricultural commodities, supporting over 125 million livelihoods across more than 70 producing countries. Global production reached approximately 170 million 60-kilogram bags in the 2023-2024 crop year, with Brazil alone contributing roughly 38 percent of total output. Vietnam is the second-largest producer, specializing in robusta beans used primarily for instant coffee and espresso blends
Specialty coffee now represents over 45 percent of U.S. coffee shop revenue, reflecting growing consumer demand for traceable, high-quality single-origin beans. Colombia, Ethiopia, and Honduras round out the top five, each contributing distinct flavor profiles shaped by altitude, climate, and processing methods. Worldwide consumption exceeds 2.25 billion cups daily, with Finland leading per capita intake at nearly 12 kilograms per person annually
The global coffee market is valued at over $460 billion, encompassing farming, roasting, retail, and specialty cafe segments. Climate change poses a significant threat, with studies projecting that 50 percent of suitable coffee-growing land could be lost by 2050 due to rising temperatures. The commodity price of arabica coffee reached decade highs in 2024 due to drought conditions in Brazil
Fair trade certification ensures minimum prices for farmers, covering approximately 2 percent of global production but influencing industry standards for ethical sourcing and sustainability practices.
Production geography explains price volatility as much as consumer trends do. Brazil’s share near 38 percent of global output, spanning roughly 60 million bags in recent ICO summaries, makes arabica yields in Minas Gerais and Sao Paulo a bellwether for world prices. Vietnam’s robusta specialization feeds instant and espresso blending segments, so weather shocks there ripple through different channels than Brazilian arabica frost or drought headlines.
Processing and altitude differentiate Colombia, Ethiopia, and Honduras in specialty markets even when their combined volume is smaller than the top two producers. Arabica roughly 60 percent of global production commands quality premiums where cup scores exceed specialty thresholds, while robusta’s higher caffeine and lower cost anchor mass-market products. US cafe revenue data show specialty segments near 45 to 55 percent by value, pushing traceability and direct trade contracts upstream.
Climate risk is structural rather than cyclical. Projections that about half of suitable coffee land could be lost by 2050 push research toward drought-tolerant varieties and higher-elevation replanting, already visible as growers migrate upslope in Central America and East Africa. The arabica price spikes linked to Brazilian drought in 2024 illustrate how physical supply tightness propagates quickly through a $460 billion global market.
Fair trade certification covers only about 2 percent of volume yet sets floor price norms that larger buyers reference in corporate sourcing policies. With roughly 125 million livelihoods tied to coffee across more than seventy countries, even small shifts in import demand or exchange rates translate into outsized welfare effects at farm gate level.
Consumption patterns anchor demand on different continents. Worldwide intake above 2.25 billion cups per day still leaves per capita averages near 1.3 kilograms globally, far below Nordic leaders such as Finland at nearly twelve kilograms. Roasting and retail concentration in importing countries means ICO crop-year totals near 170 million sixty-kilogram bags set the baseline traders watch when Brazilian or Vietnamese harvests disappoint, while specialty share gains in the United States continue to pull quality premiums back toward identifiable origins.
Quality and price are decided across a long chain. Smallholder farmers sell cherries or parchment to cooperatives, mills, and exporters, then importers, roasters, and retailers add processing and branding that capture much of the final value. Specialty coffee has opened direct-trade and premium-lot channels that reward flavor and traceability, but most volume still moves through commodity contracts linked to benchmark futures prices. For producers, shade-grown systems, improved varieties, and better farm management are practical adaptation strategies as growing conditions shift.
Frequently Asked Questions
Which country produces the most coffee?
What is the difference between arabica and robusta coffee?
How does climate change affect coffee production?
What is fair trade coffee and why does it matter?
How much coffee does the average person drink?
What is specialty coffee and why is it growing?
Sources
- International Coffee Organization (ICO), 2024
- USDA Foreign Agricultural Service, 2024
- Fairtrade International Annual Report, 2024
- World Coffee Research, 2024
- Statista, Global Coffee Market Forecast, 2025
Source links go to each publisher's official website.
Embed This Infographic
Copy the code below to share this infographic on your website
<a href="https://www.makeinfographics.ai/infographic/coffee-production-worldwide" target="_blank" rel="noopener">
  <img src="https://pic-cdn.chibistyle.app/infographics/infographics/coffee-production.webp"
       alt="Coffee Production Worldwide — Global coffee industry: Brazil and Vietnam lead production, 2.25 billion cups consumed daily, fair t"
       width="960" height="1440" loading="lazy"
       style="max-width:100%;height:auto;" />
</a>
<p>Source: <a href="https://www.makeinfographics.ai">MakeInfographics.ai</a> — Free AI Infographic Generator</p>
Create Your Own Coffee Production Worldwide Infographic
Customize this topic with your own data, style, and branding
Create Custom Version — FreeMake Something for Your Own Life
Free printable planners, blank or filled in by AI from your details.

Related Infographics
All Food & Cuisine infographics →Global Aquaculture: Fish Farming Facts 2026
Aquaculture vs wild catch production data, top producing countries, species breakdown, sustainability metrics, and environmental impact comparisons.
From Cacao Pod to Chocolate Bar: Production Process
How chocolate is made, step by step: from cacao pod harvest and fermentation to roasting, conching, and tempering, with global cocoa supply facts.
Global Fermented Food Market Statistics & Gut Health Trends 2026
Fermented food data: $980B market, gut microbiome research, kimchi and kombucha growth, probiotic supplements market, and consumer adoption trends.
Global Spice Trade & Market Statistics 2026
World spice trade data: $22.1B market, top exporting nations, most traded spices, supply chain insights, and health benefit trends driving demand.