

Electric Vehicle Market Overview Infographic
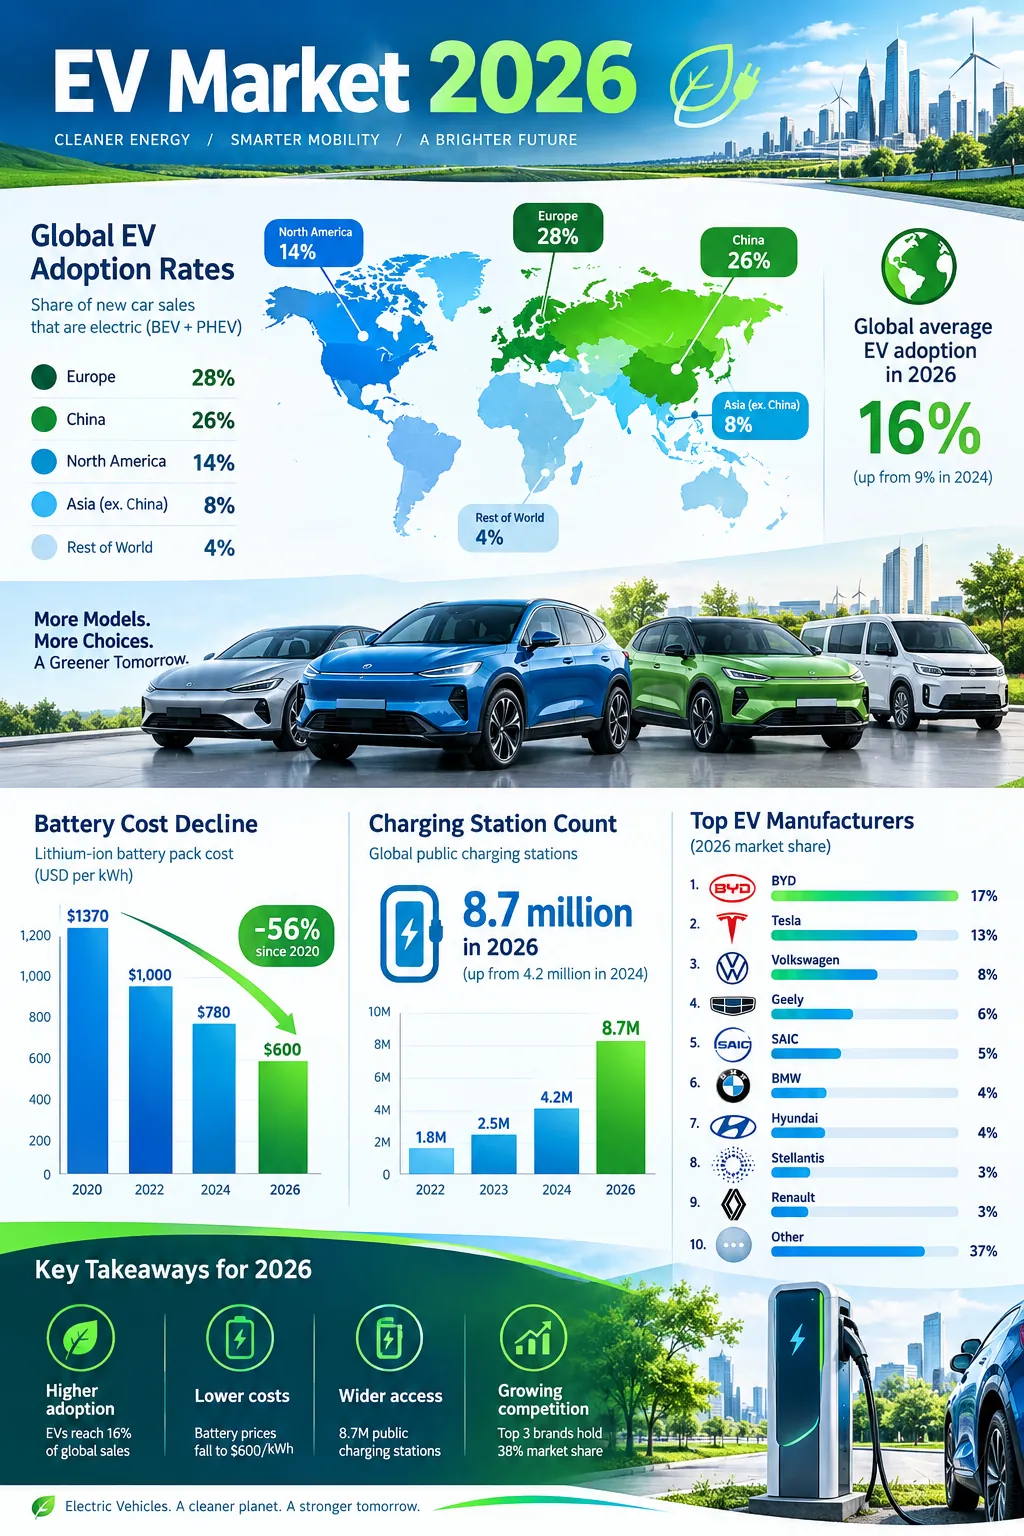
EV market 2026: 17M+ global sales, China leading at 60% share, charging network expansion, battery cost declines, and manufacturer rankings.
Published
Generate a custom version of this infographic
Customize with your own data, style, and branding
Generate This InfographicKey Statistics
- 1Global EV sales exceeded 17 million units in 2024, ~20% of new car sales (IEA Global EV Outlook)
- 2China accounts for over 60% of global EV sales (IEA)
- 3Battery pack costs fell 89% since 2010 to ~$139/kWh (BloombergNEF)
- 4Over 3.5 million public charging points installed globally by 2024 (IEA)
- 5Norway leads with 90%+ EV share of new car sales (OFV Norway)
- 6EV total cost of ownership is already lower than ICE vehicles in most markets (Consumer Reports)
- 7Tesla held ~18% global EV market share among brands in 2024 (Counterpoint Research)
About Electric Vehicle Market Overview
The electric vehicle market has entered a rapid growth phase, transforming the global automotive industry and accelerating the transition away from internal combustion engines. Global EV sales exceeded 17 million units in 2024, representing approximately 20 percent of all new car sales worldwide. China leads the market with over 60 percent of global EV sales, driven by strong government incentives and a competitive domestic manufacturing ecosystem led by BYD, NIO, and XPeng
Solid-state battery research is advancing rapidly, with several manufacturers targeting commercial production by 2027 to deliver longer range and faster charging. Europe accounts for roughly 25 percent of global sales, with Norway achieving over 90 percent EV market share for new vehicles. Battery costs have fallen 89 percent since 2010 to approximately $139 per kilowatt-hour, approaching the $100 threshold that enables price parity with gasoline vehicles
Charging infrastructure expanded to over 3.5 million public charging points globally in 2024, though distribution remains uneven across regions. Tesla maintains the largest global EV market share among individual brands, while legacy automakers including Volkswagen, BMW, and Ford are rapidly scaling electric lineups. Analysts project EVs will represent 35 to 40 percent of global new car sales by 2030, supported by tightening emissions regulations and declining total cost of ownership.
Regional structure defines the global EV story more than a single growth rate. China supplies over 60 percent of worldwide electric car sales, powered by domestic champions and sustained policy support, while Europe holds roughly a quarter of global volume with Norway exceeding 90 percent share of new registrations. North America accelerates from a lower base as legacy automakers expand battery-electric lineups alongside established leaders. These splits matter for supply chains, battery chemistry choices, and charging standards.
Battery economics remain the central lever. Pack costs fell about 89 percent since 2010 to near $139 per kilowatt-hour, approaching the widely cited $100 threshold associated with upfront parity against gasoline vehicles in many segments. Solid-state and advanced chemistries targeted toward commercial production around 2027 aim to extend range and shorten charging times, though manufacturing scale and safety certification will determine real-world timelines. Total cost of ownership already favors electrics in numerous markets when fuel and maintenance savings are included, even where sticker prices still lag.
Infrastructure is expanding but geographically uneven. Public charging surpassed three and a half million connectors globally by 2024, yet apartment dwellers and rural drivers still face access gaps that shape adoption curves. Tesla retains a leading brand share near the high teens globally, while Volkswagen, BMW, Ford, and others contest share with platform strategies tied to regional emissions rules. IEA data place global sales above 17 million units in 2024, near one fifth of new car sales, with year-over-year growth still strong in leading regions.
Used EV markets and battery health reporting will increasingly influence buyer confidence as early cohorts age. Second-hand pricing increasingly reflects state-of-health diagnostics, warranty transfer rules, and regional electricity costs, not just model year alone. Policy and industrial strategy will dominate the late 2020s. Tightening CO2 standards, local content incentives, and grid investment determine whether projections of 35 to 40 percent of new sales by 2030 materialize. Consumer Reports and similar total-cost analyses already show ownership advantages in many markets even when purchase prices remain higher than comparable gasoline models. Buyers should weigh home charging feasibility, cold-weather range, resale values, and software support alongside incentives. Fleet operators with predictable routes and depot charging often reach favorable payback before occasional drivers who rely on sparse public networks.
Grid readiness and policy support will shape the next phase of adoption. Managed charging, time-of-use pricing, and incentives for home and workplace chargers help utilities absorb new demand, while stable purchase incentives and emissions standards give automakers confidence to invest in new models.
Frequently Asked Questions
How fast is the electric vehicle market growing?
When will EVs cost the same as gasoline cars?
Which country sells the most electric vehicles?
Is charging infrastructure keeping pace with EV adoption?
Sources
- International Energy Agency (IEA) Global EV Outlook, 2024
- BloombergNEF Electric Vehicle Outlook, 2024
- Counterpoint Research EV Market Report, 2024
- Consumer Reports EV Cost Analysis, 2024
Source links go to each publisher's official website.
Embed This Infographic
Copy the code below to share this infographic on your website
<a href="https://www.makeinfographics.ai/infographic/electric-vehicle-market" target="_blank" rel="noopener">
  <img src="https://pic-cdn.chibistyle.app/infographics/infographics/ev-market.webp"
       alt="Electric Vehicle Market Overview — EV market 2026: 17M+ global sales, China leading at 60% share, charging network expansion, battery c"
       width="960" height="1440" loading="lazy"
       style="max-width:100%;height:auto;" />
</a>
<p>Source: <a href="https://www.makeinfographics.ai">MakeInfographics.ai</a> — Free AI Infographic Generator</p>
Create Your Own Electric Vehicle Market Overview Infographic
Customize this topic with your own data, style, and branding
Create Custom Version — FreeMake Something for Your Own Life
Free printable planners, blank or filled in by AI from your details.


Related Infographics
All Technology & SaaS infographics →Autonomous Vehicle Safety Statistics 2026
Self-driving car safety data, accident rates vs human drivers, sensor technology layers, regulatory milestones, and AV deployment statistics worldwide.
Robotic Process Automation (RPA) Statistics & Market Trends 2026
RPA market data: $22B industry valuation, 65% enterprise adoption, bot deployment stats, cost savings metrics, and leading automation use cases.
Edge Computing Infrastructure Statistics 2026
Edge computing infrastructure spending reached $92 billion in 2026, up 24%. See latency benchmarks, 5G small-cell growth, IoT scale, and key use cases.
Cloud Computing Market Growth 2026
Cloud infrastructure hit $143B in Q2 2026, up 43% YoY. AWS, Azure, and Google Cloud share, AI capex, sovereign cloud, and FinOps waste.