

Why Infographics Are Essential for Content Marketing
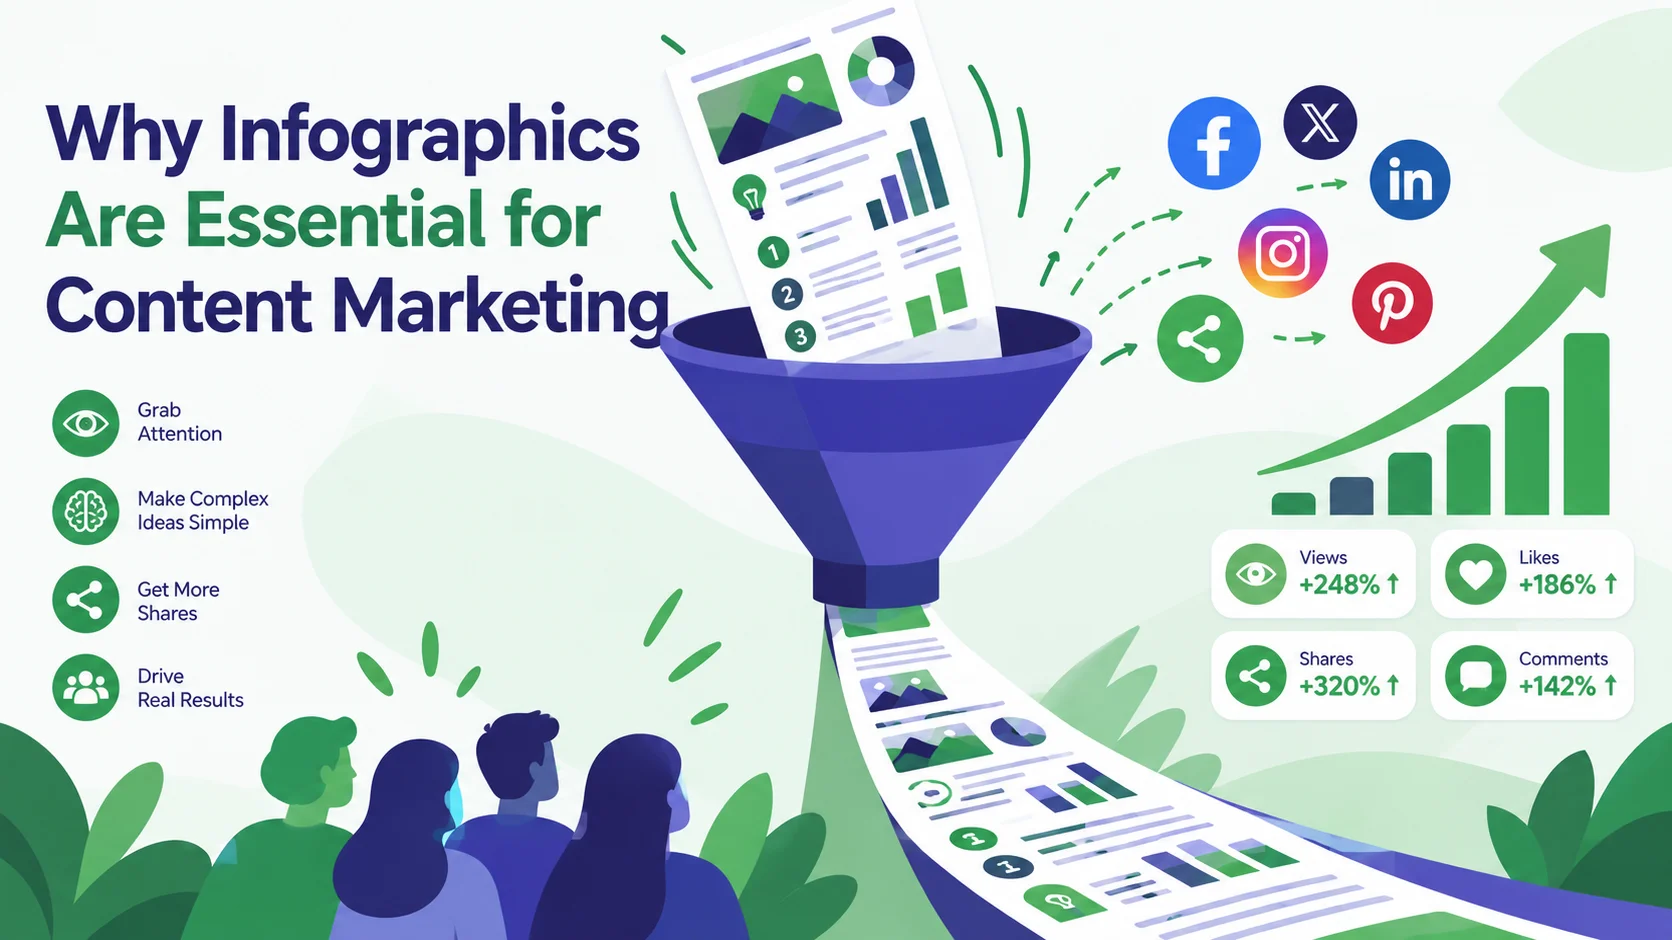
The Visual Content Advantage
Content marketing in 2026 is more competitive than ever. With millions of blog posts published every day, text alone rarely breaks through the noise. Infographics offer a proven solution: they combine data, design, and narrative into a single asset that earns attention, backlinks, and social shares at rates far exceeding traditional written content.
Marketers who consistently include infographics in their content mix report higher engagement rates, longer average session durations, and measurably better lead generation outcomes. Here is why infographics have become essential rather than optional in any serious content strategy.
Infographics Generate More Backlinks
Link building remains one of the most challenging aspects of SEO, and infographics are among the highest-performing linkable assets you can create. When you publish original research or compile industry statistics into a well-designed visual, bloggers, journalists, and industry publications link to it as a reference source.
A single high-quality infographic can earn dozens of organic backlinks over its lifetime — links that would take months to acquire through outreach alone. The key is combining unique data with professional design. Generic visuals rehashing commonly available statistics rarely attract links; original insights presented beautifully do.
Higher Engagement Across Every Channel
The engagement data for infographics is consistently strong across platforms:
- Social media: Visual posts receive 650% more engagement than text-only posts on platforms like LinkedIn and Pinterest
- Email marketing: Emails featuring infographics see 42% higher click-through rates compared to text-heavy newsletters
- Blog content: Articles with embedded infographics generate 178% more inbound links and 72% more views than text-only equivalents
- Presentations: Slides with visual data are 43% more persuasive according to audience recall studies
These numbers explain why brands investing in visual content see compounding returns over time. Each infographic continues working long after publication, generating shares and traffic with minimal additional effort.
Infographics Make Complex Topics Accessible
Many businesses sell products or services that are difficult to explain in plain text. SaaS platforms, financial instruments, healthcare procedures, and technical processes all benefit from visual simplification. An infographic distills complexity into digestible segments that prospects can understand in seconds.
Consider how a blockchain technology explainer transforms an abstract concept into a concrete visual flow. Without the infographic, explaining distributed ledgers and consensus mechanisms would require thousands of words that most prospects would never read. With it, the core concept lands in under a minute.
This accessibility directly impacts conversion rates. Prospects who understand your offering are significantly more likely to request a demo, sign up for a trial, or make a purchase.
Repurposing: One Infographic, Many Assets
One of the greatest strategic advantages of infographics is repurposability. A single well-designed infographic can be sliced into stat cards for social media, slide deck visuals for presentations, email header graphics, and embedded visuals within long-form blog articles. This multiplier effect means your investment in one infographic generates content for weeks across channels.
Building Brand Authority and Trust
Publishing data-rich infographics positions your brand as an industry authority. When your visual content is cited by other publications, shared by influencers, and referenced in presentations, it builds the kind of trust that advertising cannot buy.
The most effective approach combines proprietary data with expert analysis. Survey your customers, analyze your product usage data, or compile industry benchmarks — then visualize the findings. An infographic showing remote work productivity statistics backed by your own research carries far more authority than republishing commonly cited numbers.
SEO Benefits of Infographic Content
Beyond backlinks, infographics improve on-page SEO by increasing dwell time and reducing bounce rates. Create dedicated landing pages for your best infographics — similar to our startup funding stages page — and optimize them with structured data and embed codes that encourage sharing.
Measuring Infographic ROI
Track social shares, backlinks acquired within 90 days, page views and dwell time, and lead form submissions from gated downloads. Compare these metrics against production cost — which has dropped dramatically with AI tools — to calculate true ROI. Most teams find that infographics deliver among the highest returns of any content format.
Where Infographics Fit in the Content Funnel
Infographics are often treated as a top-of-funnel tactic, but a well-planned program uses them at every stage of the buyer journey.
- Awareness: Statistical snapshots and trend overviews earn attention and shares from people who do not know your brand yet. The goal here is reach, so make them easy to embed and credit.
- Consideration: Comparison charts, process diagrams, and checklists help prospects evaluate options and understand how a solution works. These often perform best on landing pages and in nurture emails.
- Decision: Visual summaries of pricing logic, implementation timelines, or customer results give sales teams a ready-made asset to share with stakeholders who were not on the call.
- Retention: Onboarding guides and quick-reference visuals reduce support questions and keep existing customers engaged with your product.
Mapping each planned infographic to a funnel stage prevents a common problem: producing visuals that look good but have no obvious job to do.
A Simple Infographic Content Calendar
Consistency matters more than volume. Most teams get better results from a predictable rhythm than from occasional bursts of activity. A lightweight cadence might look like this:
- One flagship infographic per month. Build it around original data or a topic your audience cares about, and give it a dedicated landing page.
- Weekly derivative assets. Slice the flagship into stat cards, quote graphics, and short carousels for social channels and email.
- Quarterly refresh. Revisit your top performers, update the numbers, and republish with a visible update date to keep them current.
Plan topics a quarter ahead so research, review, and design do not collide with campaign deadlines. AI generation shortens the design step, which frees time for the part that actually differentiates your content: the quality of the data and the clarity of the message.
Choosing Topics That Earn Links and Shares
The topic decides how far an infographic travels. Before committing, run it through four quick filters:
- Is there original or newly packaged data? Content that adds something new gets cited. Content that repeats widely available numbers gets ignored.
- Does it answer a real question? Check what your customers ask in sales calls, support tickets, and search suggestions, then build the visual around the answer.
- Is it timely or evergreen? Timely topics spike quickly; evergreen topics keep earning traffic for years. A healthy mix of both protects your results.
- Can it be understood visually? Comparisons, sequences, and distributions suit infographics well. Abstract opinions rarely do.
Browse the infographic gallery to see how different industries package data into shareable visuals, then look for gaps in the topics your own audience searches for.
Mistakes That Waste an Infographic's Potential
Even strong designs underperform when they are published carelessly. Avoid hiding the infographic on a page with no explanatory text, because search engines and screen readers need written context. Do not publish without a source line, since unattributed numbers are rarely linked. Resist adding five calls to action; one clear next step converts better than several competing ones. And do not treat publication as the finish line: promote the piece across social, email, and outreach for several weeks, and revisit its performance before planning the next one.
Infographics Compared With Other Content Formats
Infographics work best as one part of a mix, so it helps to know where they are stronger and where another format is a better choice.
- Versus long-form articles: Articles carry nuance and depth, while infographics deliver the headline findings quickly and are easier to share. The strongest programs pair them, placing the visual at the top of a detailed article.
- Versus video: Video builds personality and handles demonstrations well, but it costs more to produce and cannot be skimmed. Infographics let viewers absorb the main points in seconds and return to specific numbers later.
- Versus whitepapers and reports: Reports establish expertise, yet many go unread. An infographic summarizing the top findings makes the report discoverable and gives readers a reason to request the full document.
- Versus social text posts: Text is fast to write but easy to scroll past. A visual with one clear statistic is far more likely to stop the scroll and be saved.
The practical takeaway is to treat infographics as the summarizing layer of your content: the piece that makes deeper assets easier to find, understand, and share.
Getting Buy-In From Your Team
Even the best infographic strategy stalls without support from the people who approve budgets and review content. Start small: pick one topic where you already have good data, publish a single infographic, and report its results — shares, links earned, and traffic — in a short, simple summary. Concrete numbers from a small pilot persuade stakeholders far more effectively than general claims about visual content, and they give you a baseline for deciding how much to invest next.
Start Building Your Visual Content Strategy
Infographics are not a nice-to-have addition to your content marketing program — they are a core asset class that drives measurable results across SEO, social media, email, and sales enablement. The production barrier has never been lower, thanks to AI-powered design tools that handle layout and visual styling automatically.
Ready to add infographics to your content mix? Create your first marketing infographic in minutes and start capturing the engagement that text-only content cannot deliver.
Keep reading: Turn the visuals into pipeline with our guide to using infographics for lead generation.
Create Your Own Infographic
Apply what you learned and generate a professional infographic with AI in seconds.
Start Creating — FreeRelated Articles
Infographics for Social Media: Sizes, Strategies & Tips for 2026
Social media infographic sizes for every platform in 2026, plus engagement strategies and proven tactics to maximize shares and reach.
MarketingHow to Use Infographics for SEO: A Data-Driven Ranking Guide
How infographics support SEO: earn backlinks, increase dwell time, and rank higher with visual content. Proven, data-driven techniques.
MarketingPinterest Marketing for Infographics: The Complete 2026 Guide
Drive Pinterest traffic with infographics. Covers pin optimization, board strategy, Rich Pins, scheduling, analytics, and proven growth tactics.