


Wine Region Guide
Sophisticated wine region comparison with tasting notes, varietals, and pairing recommendations.
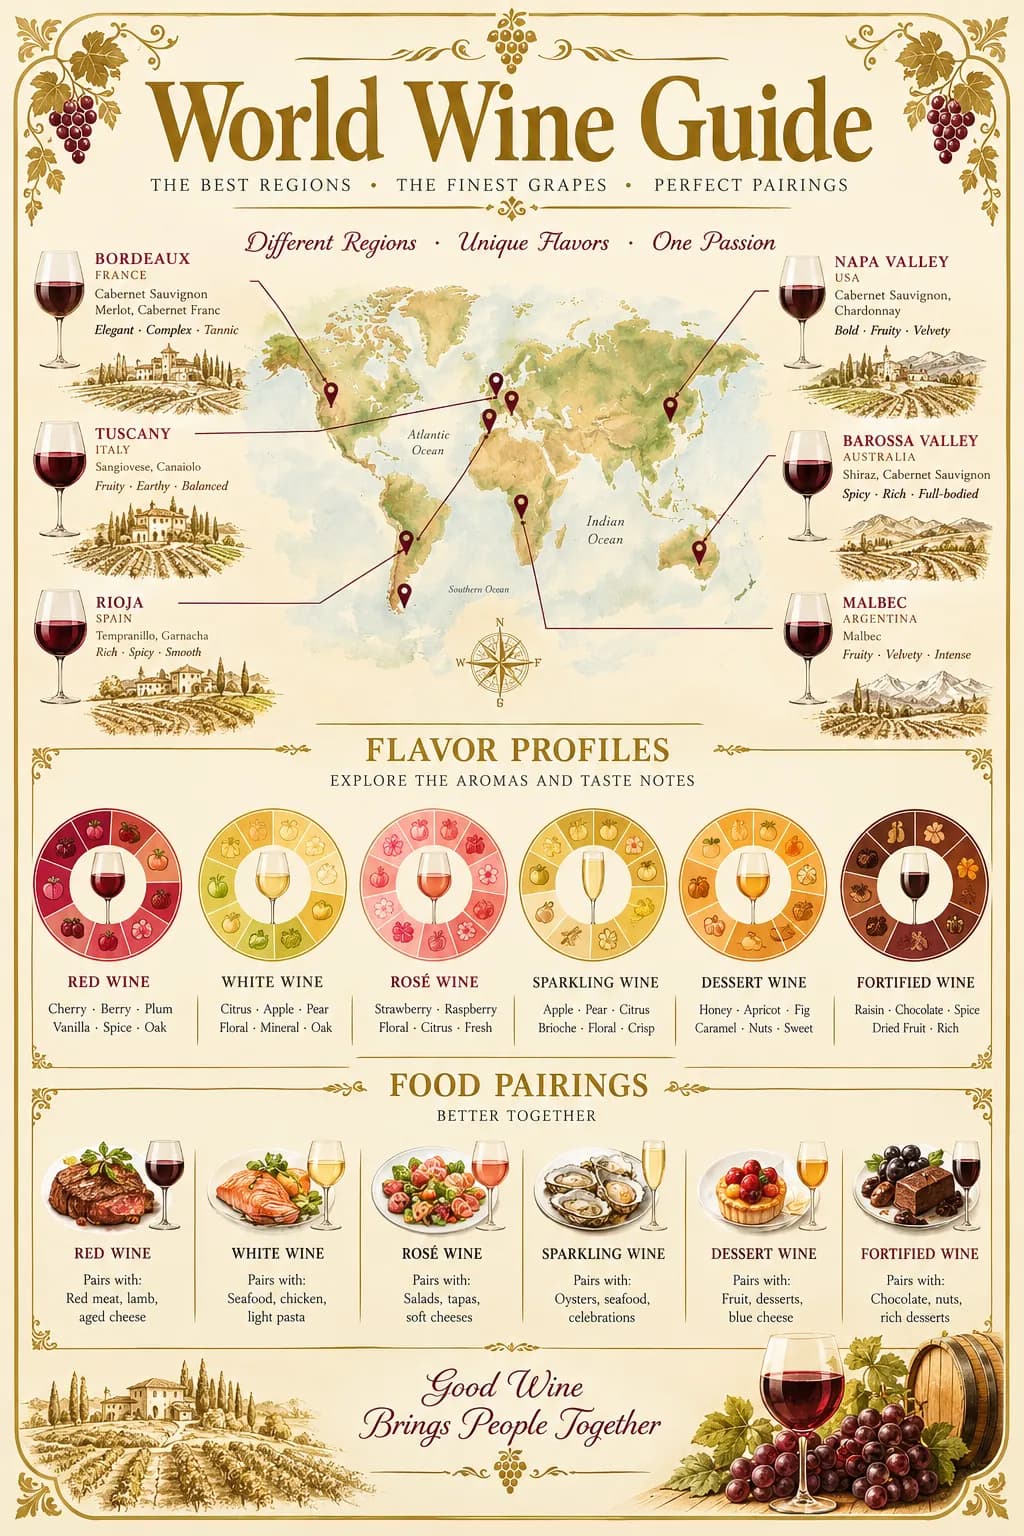
Generate this infographic with AI
Pre-filled with the Wine Region Guide topic in Elegant style — customize and generate in seconds
Use This TemplateWhy Use a Wine Region Guide Infographic?
Wine education content bridges a gap between intimidating sommelier-level knowledge and oversimplified 'red vs. white' guides. This template helps wine retailers, restaurants, hospitality brands, and lifestyle bloggers create reference-worthy content that readers save and share. The elegant style with its cream backgrounds and refined typography matches the sophistication of the subject matter while keeping the content accessible to beginners. Wine infographics consistently rank among the most-saved and most-shared content in the food and beverage category on Pinterest and Instagram.
Best Practices for Wine Region Guide Infographics
Key Metrics to Include
Make your wine region guide infographic data-driven by including these essential metrics:
About the Elegant Style

Elegant — Luxury design, gold accents
Cream backgrounds with gold accents and serif typography. Ideal for premium brands, luxury product comparisons, and high-end market reports. Refined borders and ornamental details.
Browse all Elegant templatesHow to Create Your Wine Region Guide Infographic
Click Use This Template
The AI generator opens with the "Wine Region Guide" topic and Elegant style already selected. The prompt includes relevant data points like annual production volume by country and average price per bottle by region.
Add Your Own Data
Replace the sample data points with your actual numbers. Organize regions by flavor profile (light-bodied → full-bodied) rather than alphabetically so readers can navigate by preference.
Generate & Download
Hit Generate and your infographic is ready in seconds. Download the high-resolution image for social media, presentations, or your website.
Ready to Create Your Wine Region Guide Infographic?
No design skills needed. Just customize the topic and let AI do the rest.
Use This Template — FreeRelated Templates

Luxury Real Estate Market
Elegant style · Real Estate
Premium market overview with gold accents. Housing trends, price analysis, and investment opportunities.
Data Privacy & Compliance Guide
Elegant style · Technology
Comprehensive data privacy compliance infographic covering GDPR, CCPA, and emerging regulations. Ideal for legal teams, DPOs, and compliance officers needing a clear visual reference for global privacy requirements.
Event Day Timeline
Elegant style · Lifestyle
An hour-by-hour timeline with who is responsible for each step, plus vendor contacts. Print it blank, or let AI build it from your key times.

Coffee Origins & Brewing
Vintage style · Lifestyle
Warm, nostalgic coffee guide with brewing methods, bean origins, and flavor profiles on aged paper textures.